The correct curve between XL and logf is


The correct Answer is:C
To find the correct curve between XL (inductive reactance) and logf (the logarithm of frequency), we start by recalling the relationship between XL and frequency f.
1. Understand the Relationship:
The inductive reactance XL is given by the formula:
XL=ωL
where ω (angular frequency) is related to frequency f by:
ω=2πf
Therefore, we can rewrite XL as:
XL=2πfL
2. Express XL in terms of f:
From the above equation, we can express XL as:
XL=2πLf
This indicates a linear relationship between XL and f.
3. Taking the Logarithm of Frequency:
We want to plot XL against logf. To do this, we can express f in terms of logf:
f=elogf
4. Substituting f into the Equation:
Now, substituting f=elogf into the equation for XL:
XL=2πLelogf
This shows that XL is proportional to elogf.
5. Understanding the Graph:
Since XL is directly proportional to f, and f is an exponential function of logf, the relationship between XL and logf will be a straight line. Specifically, it will be a linear graph where XL increases exponentially as logf increases.
6. Plotting the Graph:
On the graph, we will plot XL on the y-axis and logf on the x-axis. The resulting graph will show a linear increase, indicating that as logf increases, XL also increases.
Conclusion:
The correct curve between XL and logf is a straight line with a positive slope.
The inductive reactance XL is given by the formula:
XL=ωL
where ω (angular frequency) is related to frequency f by:
ω=2πf
Therefore, we can rewrite XL as:
XL=2πfL
From the above equation, we can express XL as:
XL=2πLf
This indicates a linear relationship between XL and f.
We want to plot XL against logf. To do this, we can express f in terms of logf:
f=elogf
Now, substituting f=elogf into the equation for XL:
XL=2πLelogf
This shows that XL is proportional to elogf.
Since XL is directly proportional to f, and f is an exponential function of logf, the relationship between XL and logf will be a straight line. Specifically, it will be a linear graph where XL increases exponentially as logf increases.
On the graph, we will plot XL on the y-axis and logf on the x-axis. The resulting graph will show a linear increase, indicating that as logf increases, XL also increases.
The correct curve between XL and logf is a straight line with a positive slope.
Similar Questions
The current curve between logejT2 and lT
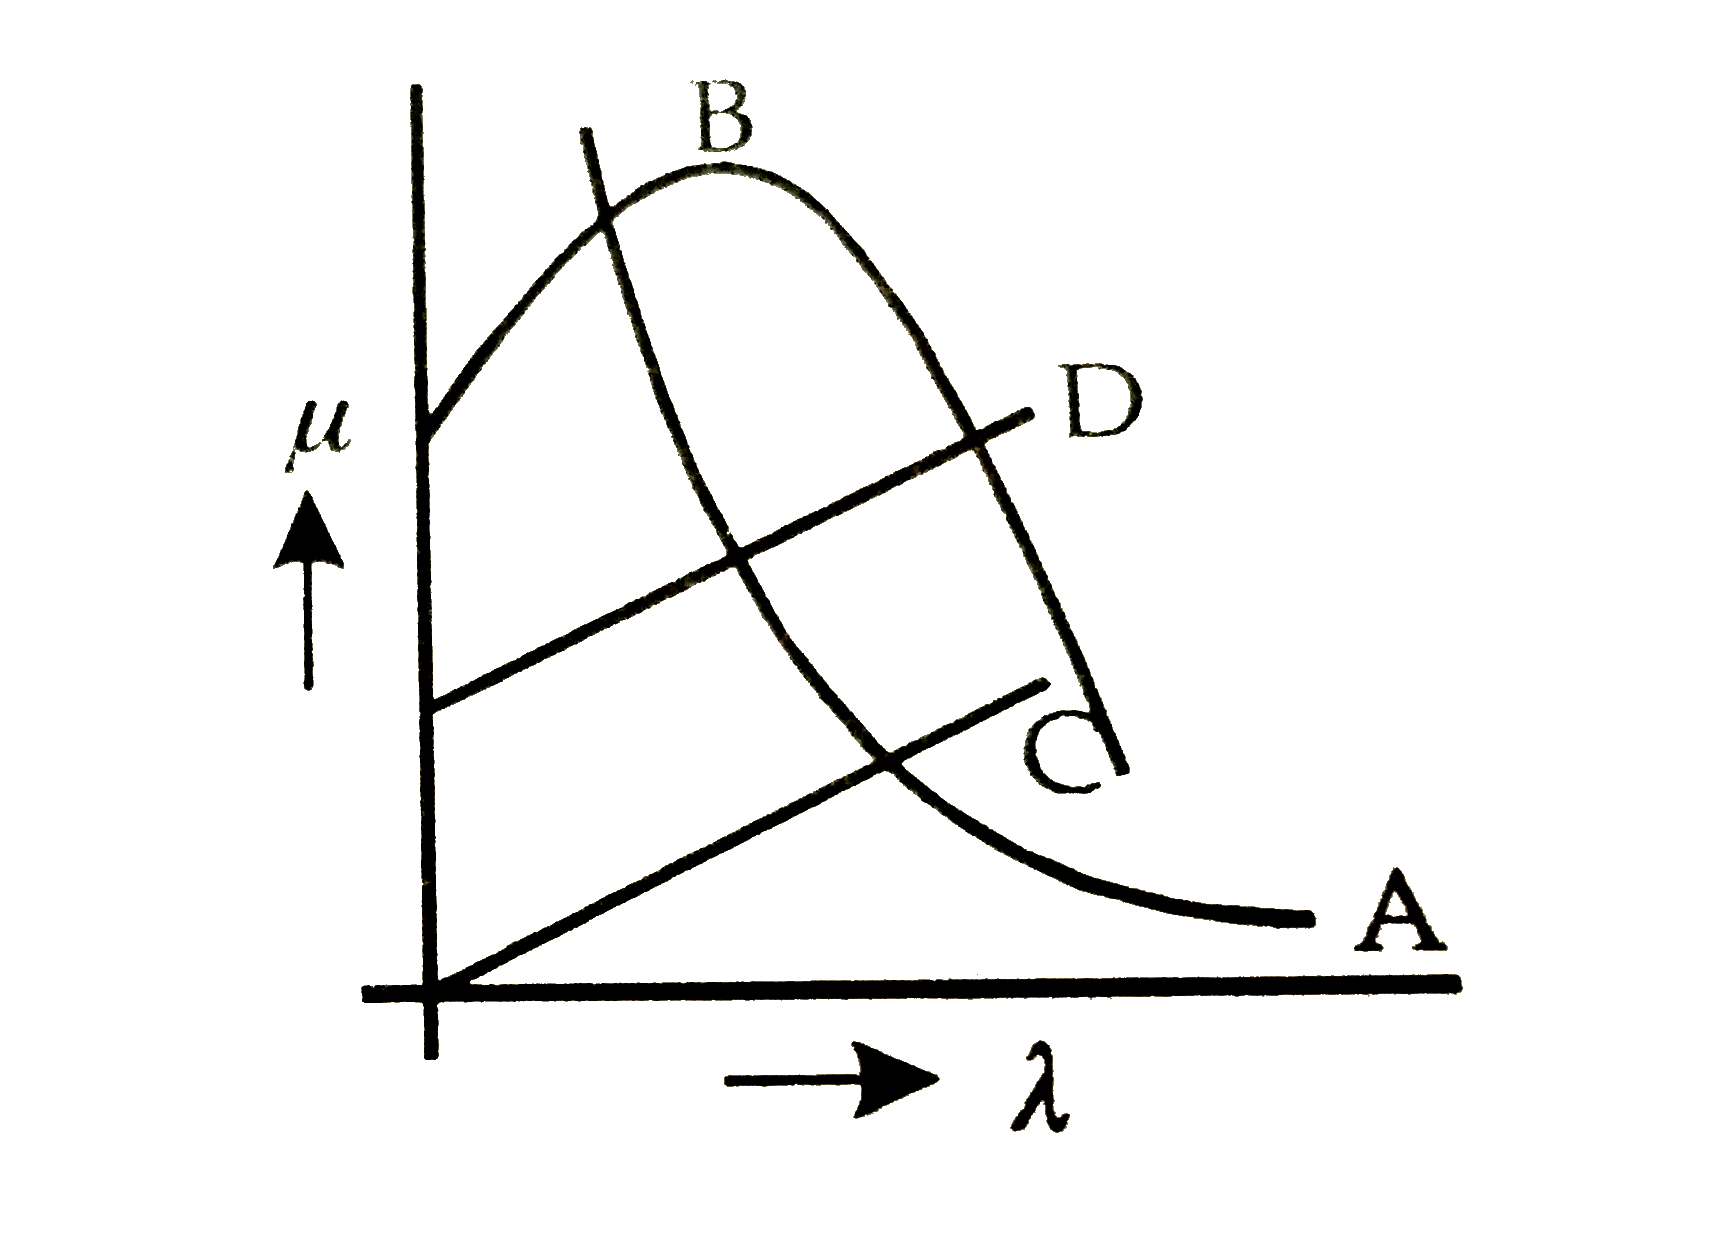
View SolutionThe correct curve between refractive index μ and wavelength λ will be

View SolutionThe correct curve between the magnetic induction (B) along the axis of a along solenoid due to current flow i in it and distance x from one end is -
View SolutionThe correct curve between the height or depression h of liquid in a capillary tube and its radius is
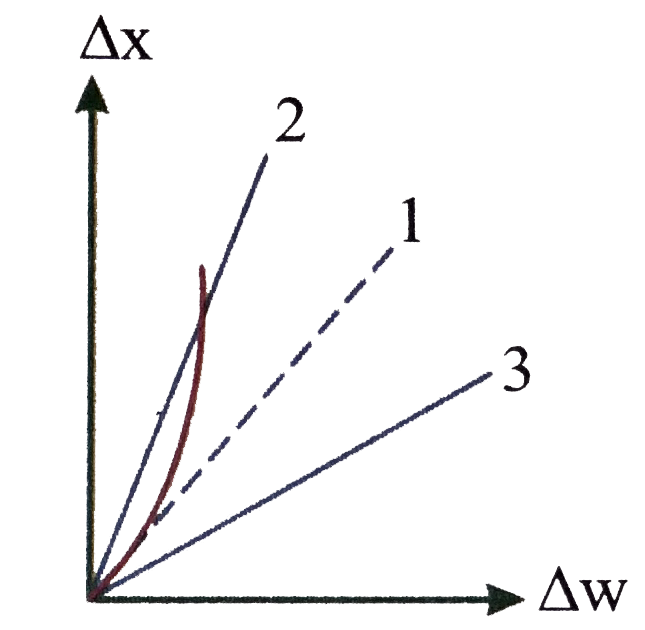
View SolutionIn the experiment, the curve between ΔX and ΔW is shown as dotted line (l). If we use an another wire of same material, but with double length and double radius. Which of the curve is expected.

View SolutionIn pure inductive circuit, the curves between frequency f and reciprocal of inductive reactance 1/XL is
View SolutionConsider the lines L1≡3x−4y+2=0 and L2≡3y−4x−5=0. Now, choose the correct statement(s).
(a)The line x+y=0 bisects the acute angle between L1and L2 containing the origin.
(b)The line x-y+1=0 bisects the obtuse angle between L1 and L2 not containing the origin.
(c)The line x+y+3=0 bisects the obtuse angle between L1 and L2 containing the origin.
(d)The line x-y+1=0 bisects the acute angle between L1 and L2 not containing the origin.
View SolutionFind the area of the region bounded by the curve y=sinx between x=0andx=2π.
View SolutionThe area between curve y=x2 and the line y=2 is
View SolutionArea of the regionbounded by the curve y=cosx between x=0 and x=π is
View Solution
