A broad metal plane is connected to earth through a conducting wire as shown. An electron flies with constant velocity along a straight line above the plate at a distance much less than the linear dimensions of the plate. If the current I flowing from the earth to the plate is considered to be positive, then which of the following graph correctly depicts the variation of current I with time ?
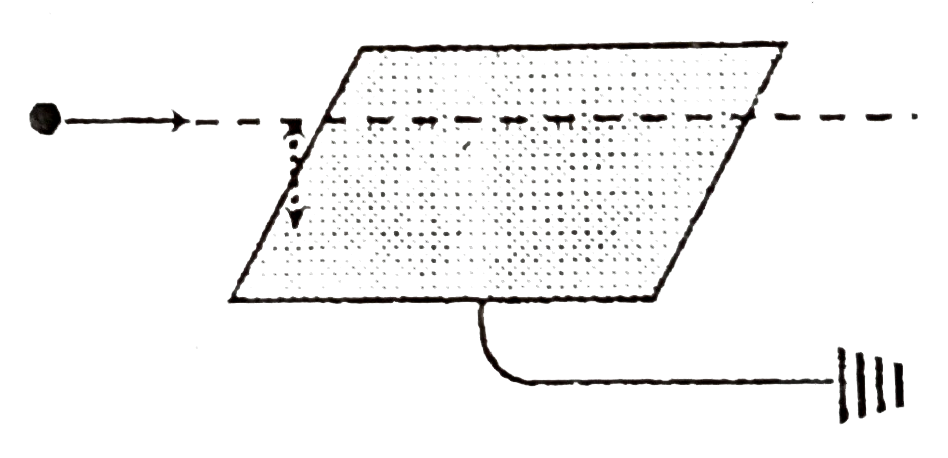
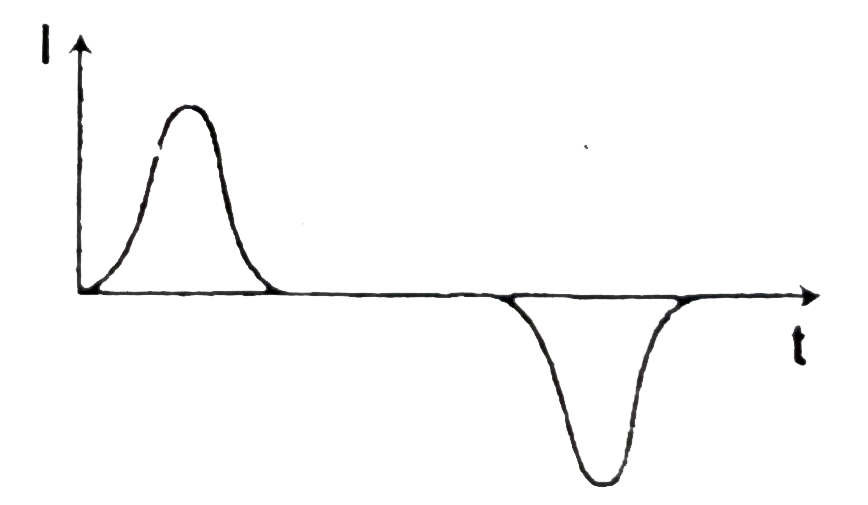
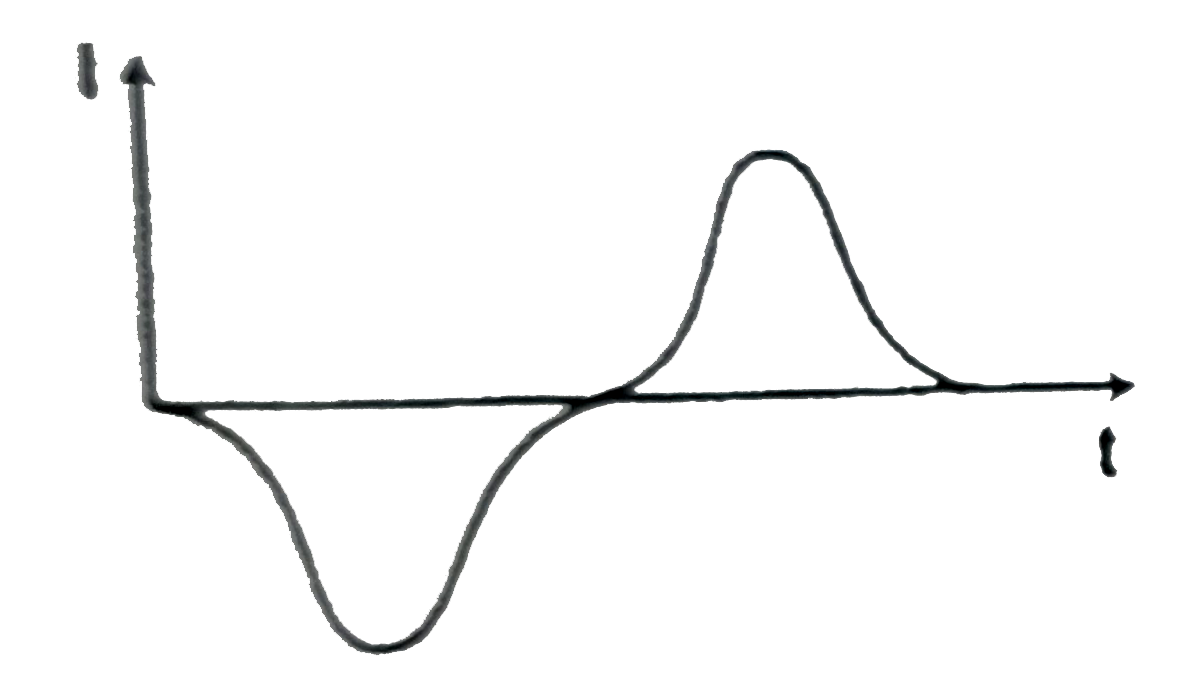
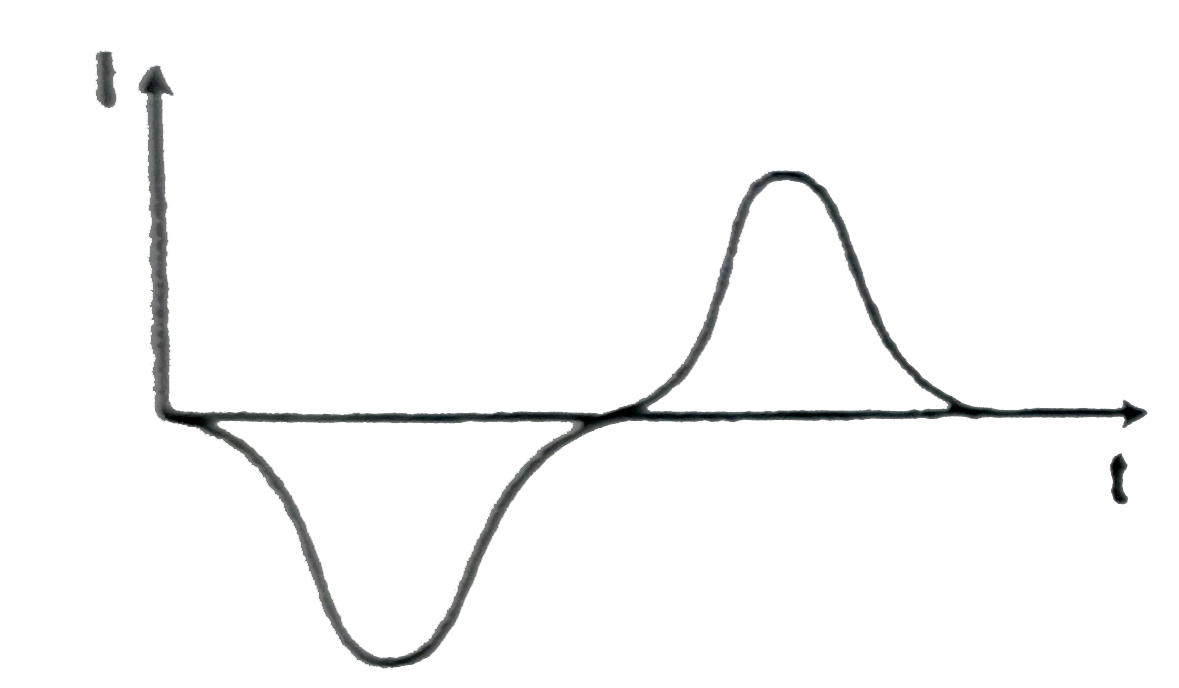

Step by step video solution for A broad metal plane is connected to earth through a conducting wire as shown. An electron flies with constant velocity along a straight line above the plate at a distance much less than the linear dimensions of the plate. If the current I flowing from the earth to the plate is considered to be positive, then which of the following graph correctly depicts the variation of current I with time ? by Physics experts to help you in doubts & scoring excellent marks in Class 12 exams.
Updated on:21/07/2023Similar Questions
Which of the following graphs correctly represents the variation of g on the - Earth?
View SolutionSwitch S of the circuit shows in Fig. is closed at t=0. If e denotes the induced emf in L and i the current flowing through the circuit at time t, then which of the following graphs correctly represents the variation of e with i?
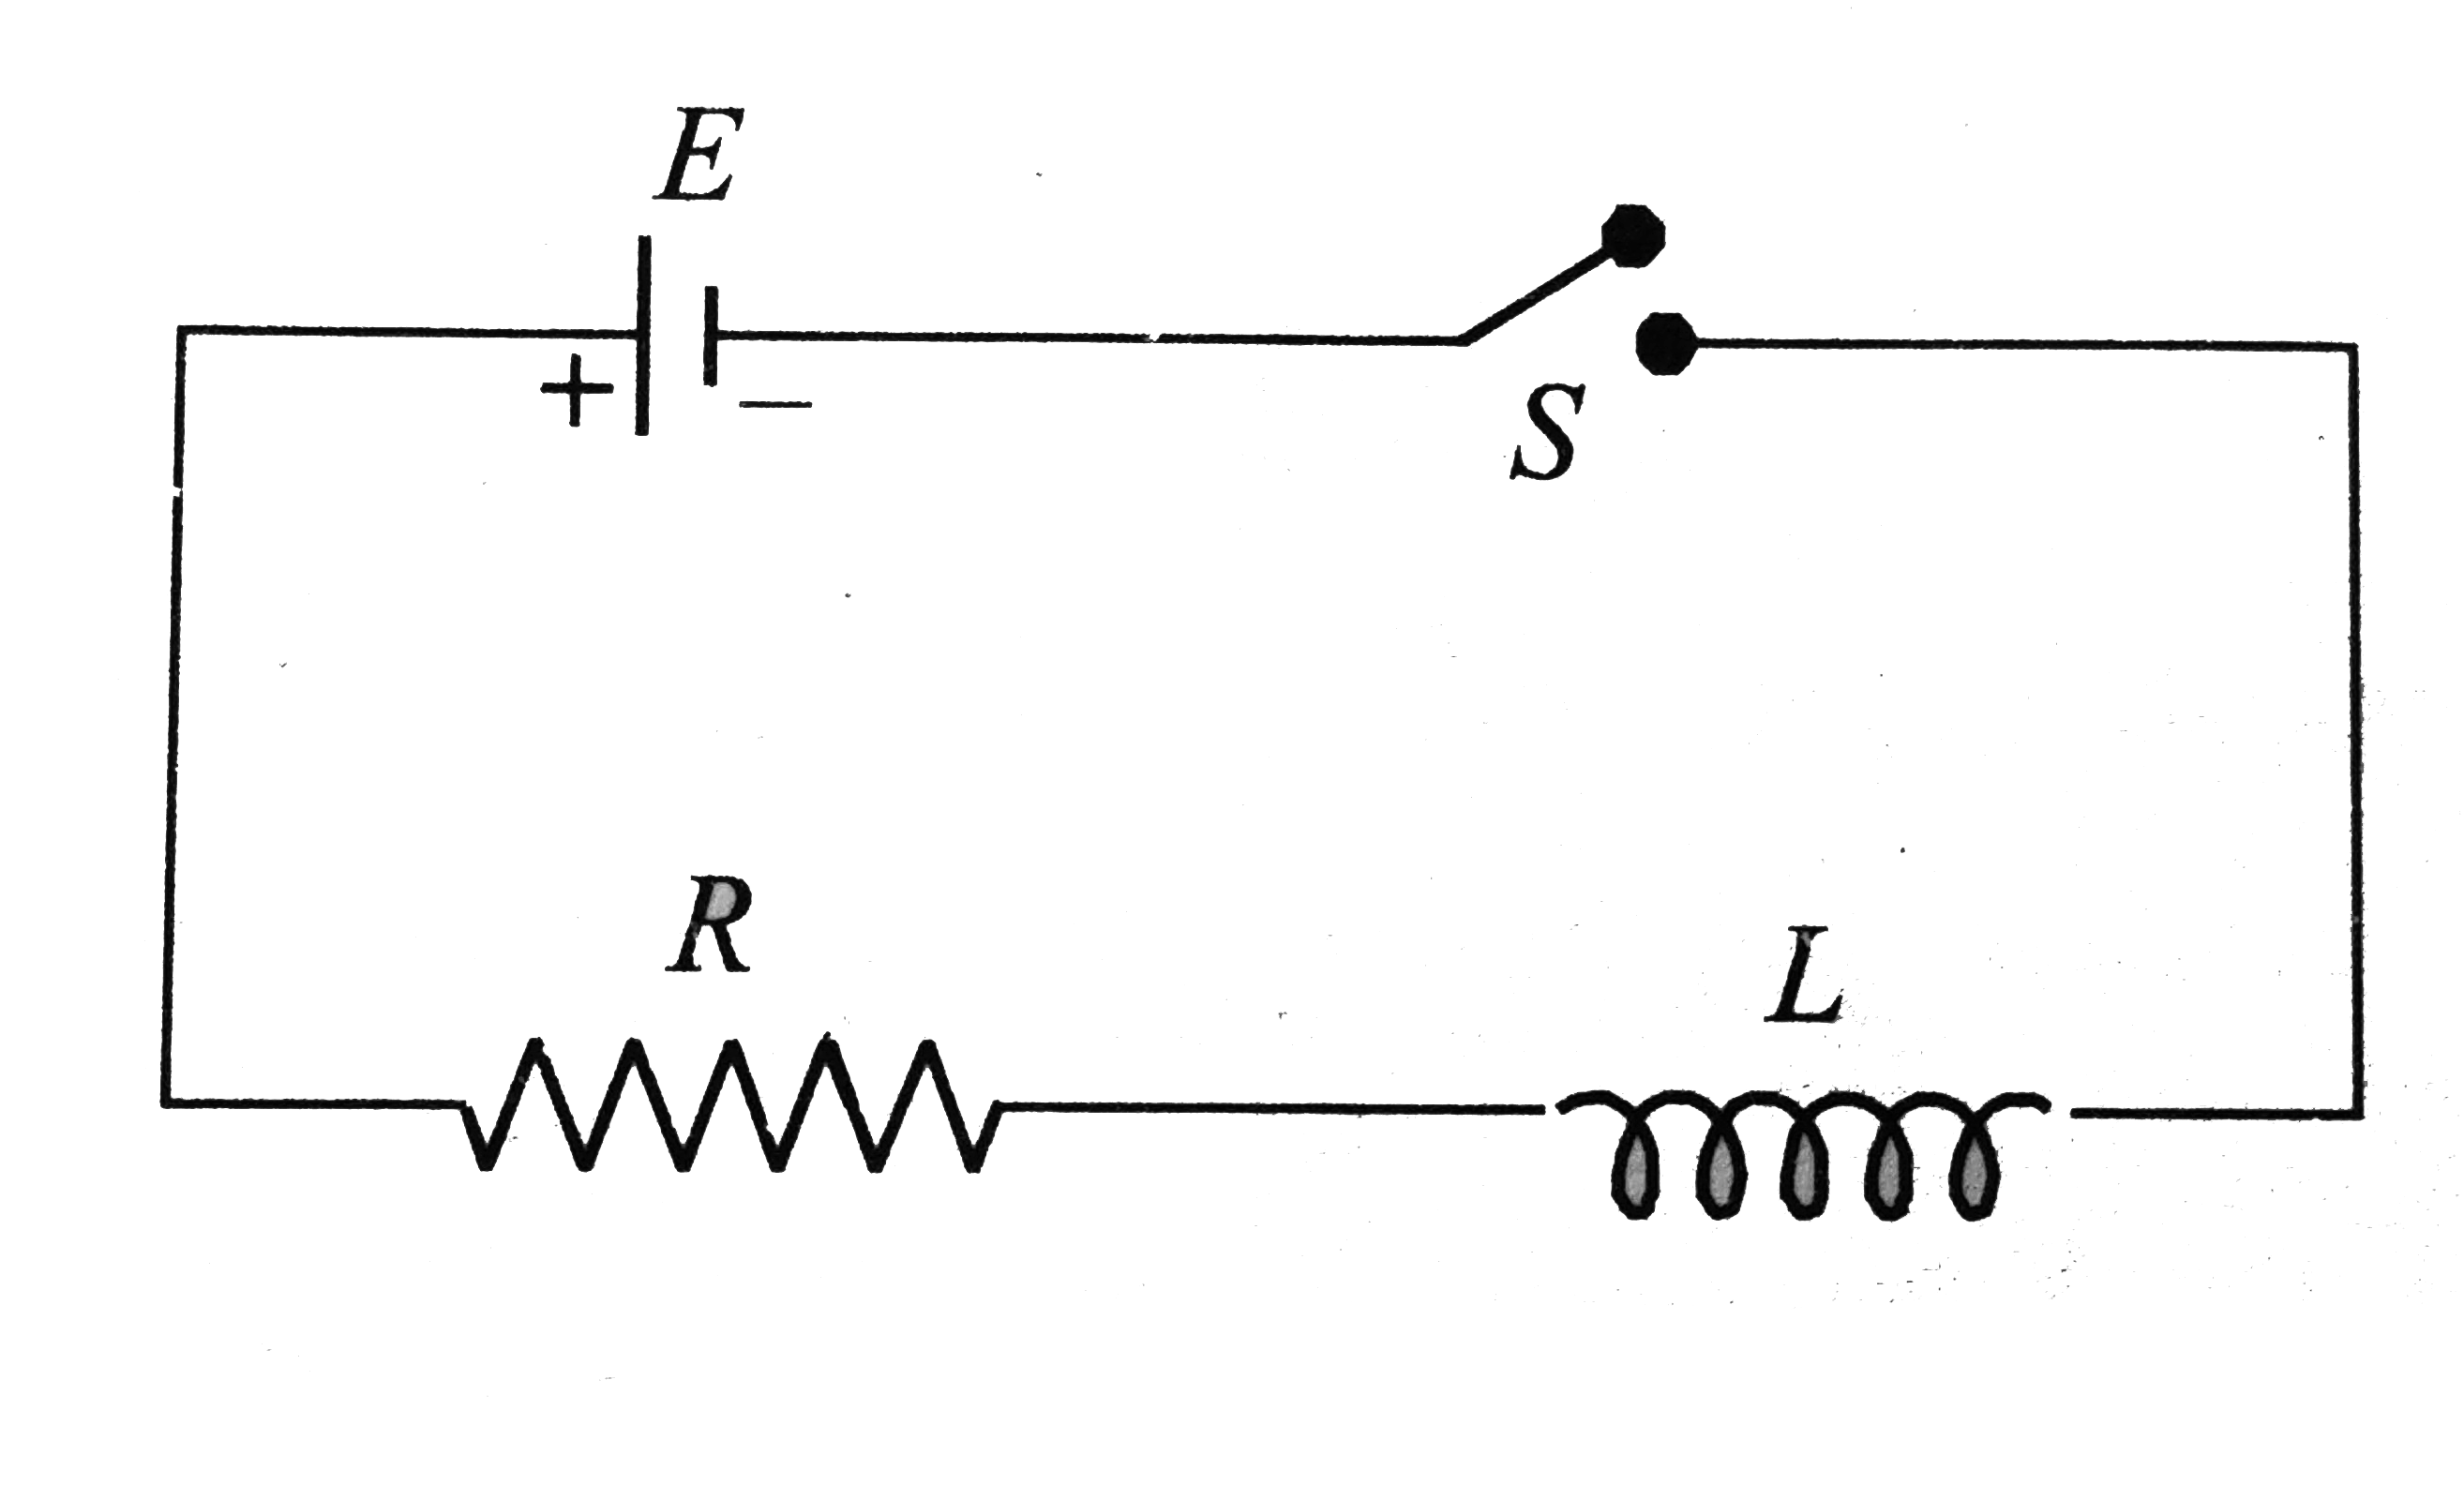
View SolutionAn alternating current I in an inductance coil varies with time t according to the graph as shown: Which one of the following graph gives the variation of voltage with time?
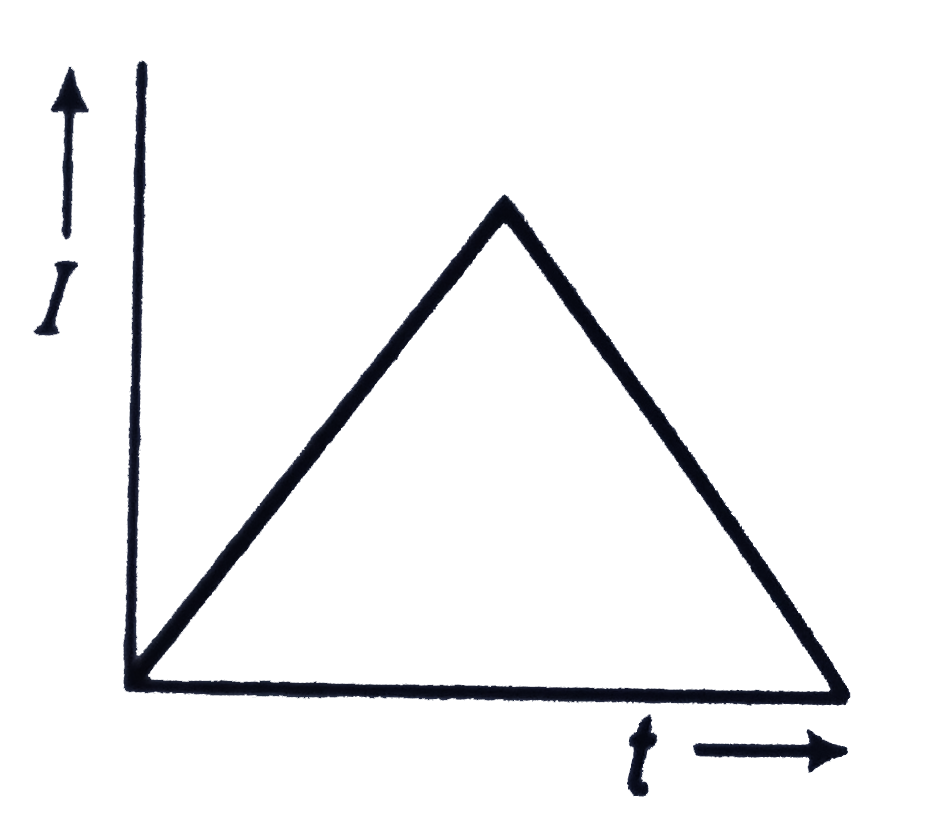
View SolutionAn alternating current I in an inductance coil varies with time t according to the graph as shown: Which one of the following graph gives the variation of voltage with time?

View SolutionNear a circular loop of conducing wires as shown, an electron moves along a straight line. The direction of induced current if any, in the loop is

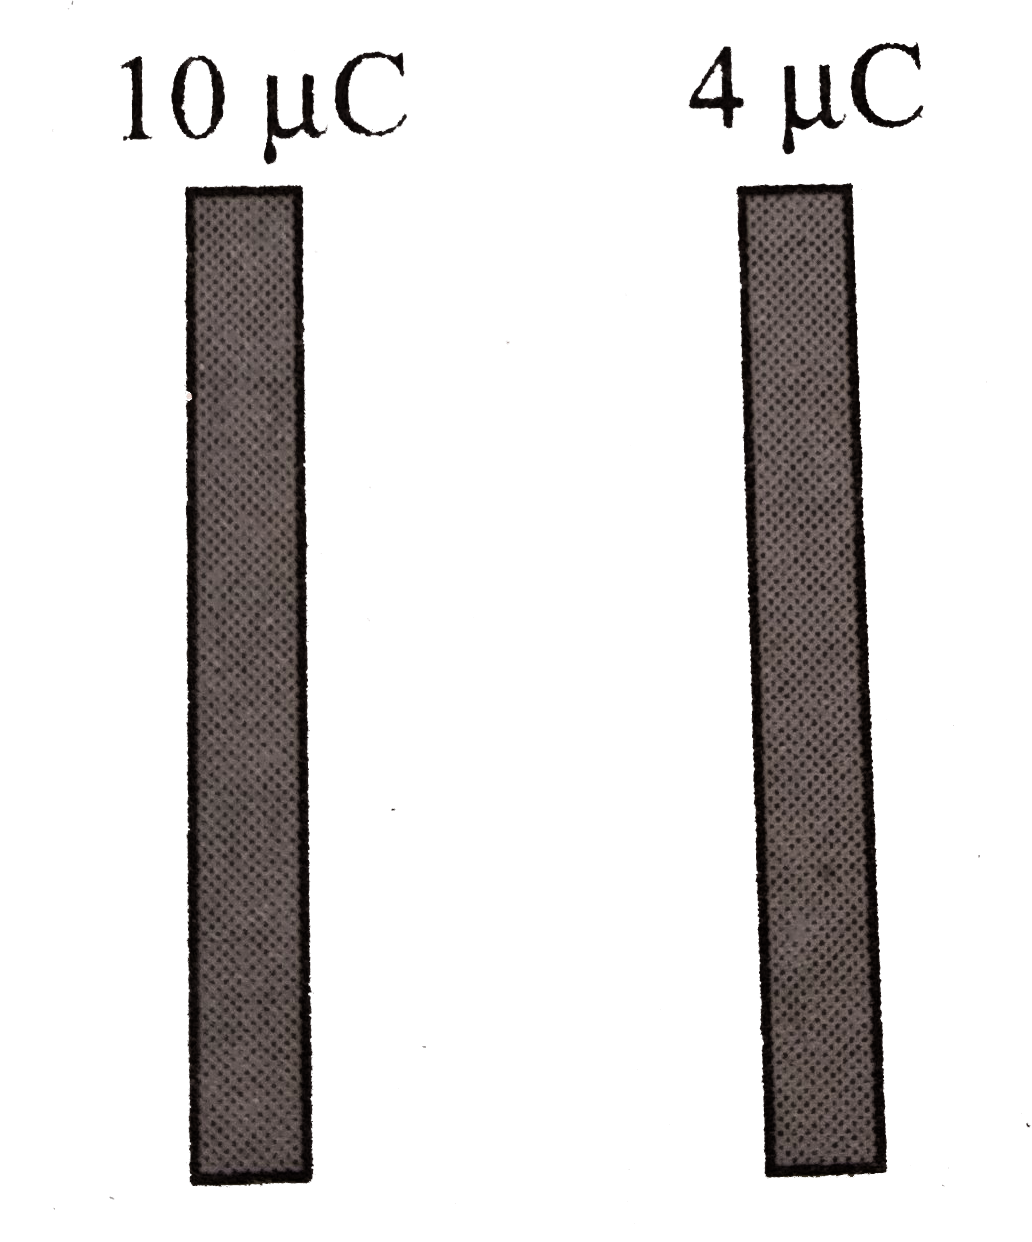
View SolutionTwo large plates are given the charges as shown in figure. Now, the left plane is earthed. Find the amount of charge that will flow from the earth to the plate.
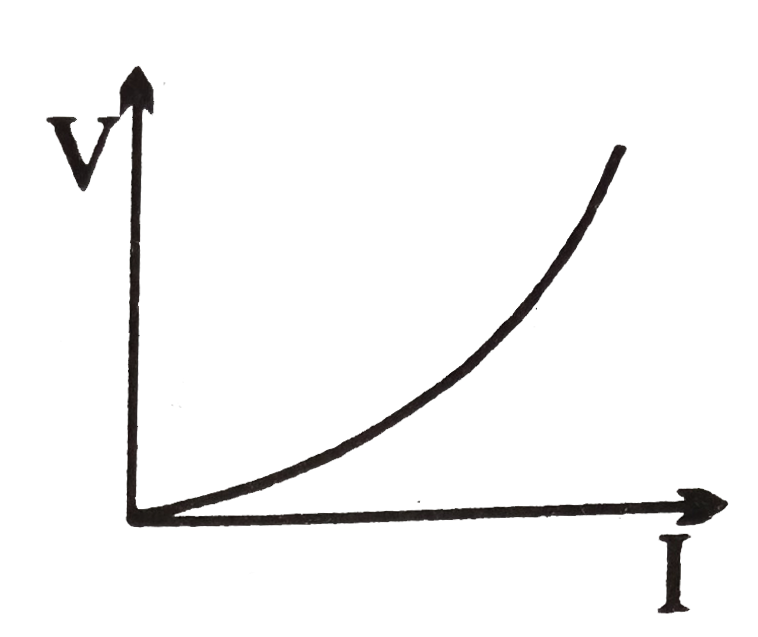
View SolutionThe variation of current (I) and voltage (V) is as shown in figure A. The variation of power P with current I is best shown by which of the following graph
View SolutionAn insulator plate is passed between the plates of a capacitor. Then current
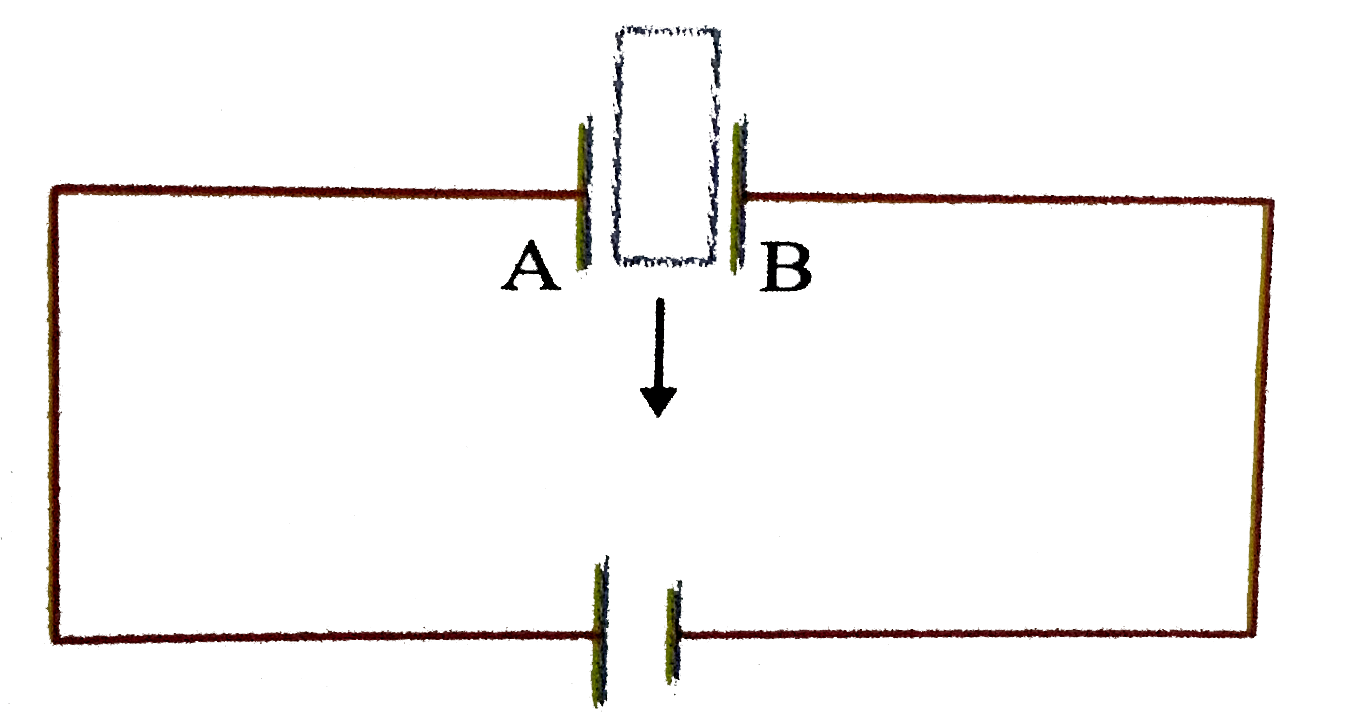 .
.
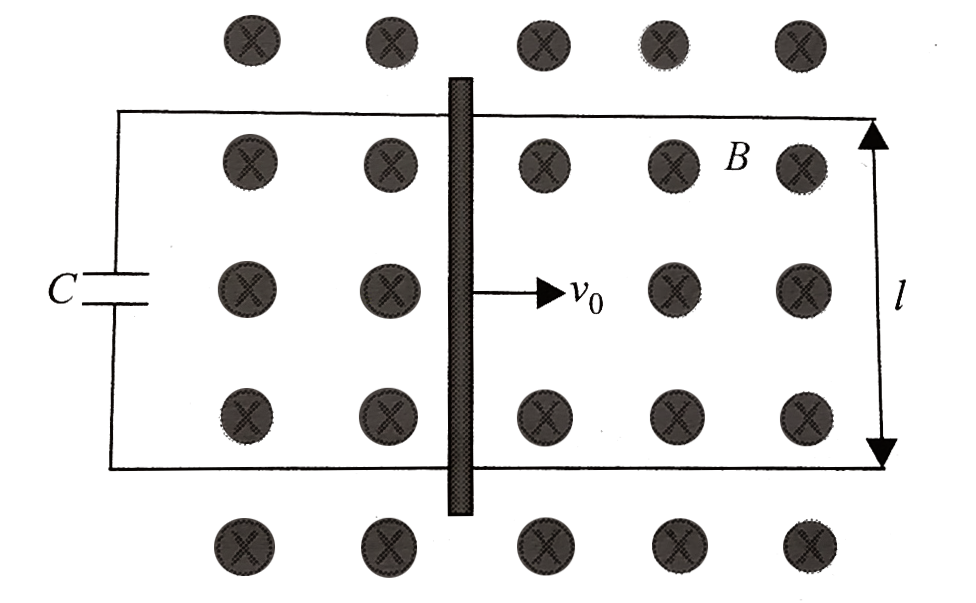
View SolutionTwo infinitely long conducting parallel rails are connected through a capacitor C as shown in Fig. A conductor of length l is moved with constant speed v0. Which of the following graph truly depicts the variation of current through the conductor with time?
View SolutionA flat plate is moving normal to its plane through a gas under the action of a constant force F. The gas is kept at a very low pressure. The speed of the plate v is much less than the average speed u of the gas molecules. Which of the following options is/are true ?
View Solution
