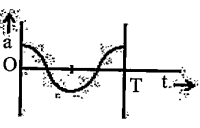
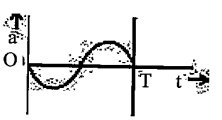
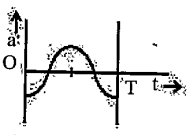
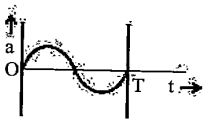
The oscillation of a body on a smooth horizontal surface is represented by the equation, X = A cos (ωt) where X = displacement at time t omega = frequency of oscillation Which one of the following graphs shows correctly the variation a with it? Solution in Tamil


Step by step video & image solution for The oscillation of a body on a smooth horizontal surface is represented by the equation, X = A cos (omegat) where X = displacement at time t omega = frequency of oscillation Which one of the following graphs shows correctly the variation a with it? by Physics experts to help you in doubts & scoring excellent marks in Class 11 exams.
Updated on:21/07/2023Topper's Solved these Questions
Similar Questions
A particle moving along x-axis has accelaration f, at time t , given by f=f0(1−tT) where f0 and T are constants . The particle at t=0 has zero velocity . In the time interval between t=0 and the instant when f=0, the particle's velocity (νx) is:
View SolutionDimensions of resistance in an electrical circuit, in terms of dimension of mass [M], of length [L], of time [T) and of current [I], would be
View SolutionThe oscillation of a body on a smooth horizental surface is respresented by the equation X = A cos (omegat) where one of the following graph shown correctly the variation a with t ?
View SolutionThe oscillationof a body on a smooth horizontal surface is represented by the equation
x=Acosωt
where x= displacement at time t, ω= frequency of oscillation. Which one of the following graphs shows correctly the variation of acceleration a with time t ?
View SolutionThe oscillation of a body on a smooth horizontal surface is represented by the equation,
X=Acos(ωt)
where, X = displacement at time t
ω= frequency of oscillation
Which one of the following graphs shows correctly the variation a with t?
Here, a = acceleration at time t
T = time period
View SolutionThe oscillation of a body on a smooth horizontal surface is represented by the equation, X=Acos(ωt)
where X = displacement at time t
ω = frequency of oscillation
Which one of the following graphs shows correctly the variation a with t ?
View SolutionThe displacement of an oscillator is given by x=a sin omega t+b cos omega t where a, b and omega , are constant. Then -
View Solutionएक चिकने क्षैतिज तल पर किसी पिण्ड के दोलन निम्न सूत्र द्वारा प्रदर्शित हैं : x=Acosωt, जहाँ x किसी क्षण t पर विस्थापन तथा ω दोलनों की आवृत्ति है | त्वरण a तथा समय t के बीच ग्राफ होगा :
View Solutionदोलन करते हुए एक कण का विस्थापन x=asinωt+bcosωt द्वारा प्राप्त होता है जहाँ a,b नियतांक है -
दर्शाइए की कण की गति सरल आवर्त गति है।
View SolutionThe oscillation of a body on a smooth horizontal surface is represented by the equation,
X=Acos(ωt)
where X= displacement at time t
ω = frequency of oscillation.
Which one of the following graph shows correctly the variation a with ?
View SolutionThe oscillation of a body on a smooth horizontal surface is represented by the equation, x=Acosomegat , where x = displacement at time t, omega = frequency of oscillation. Which one of the following graphs shows correctly the variation a with t ? Here, a = acceleration at time t and T = time period.
View SolutionThe oscillation of a body on a smooth horizontal surface is represented by the equation x=Acosωt where x = displacement at time t, ω= frequency of oscillation. Which of the following graphs shows the corrects variation of acceleration 'a' with time 't'.
View SolutionThe equation of oscillations on the smooth horizontal surface of a body " " X-A cos (omegat ) by Is denoted as x- t Time displacement omega - Oscillation frequency So which graph (graph) represents the deviation (change) of 'a' with 't' correctly?
View SolutionThe oscillation of a body on a smooth horizontal surface is represented by the equation, X = A cos (omega t) where, X = displacement at time t omega = frequency of oscillation Which one of the following graphs shows correctly the variation a with t? Here, a = acceleration at time t T = time period
View SolutionThe oscillation of a body on a smooth horizental surface is respresented by the equation
X=Acos(ωt)
where one of the following graph shown correctly the variation a with t?
View SolutionDraw graph showing the variation of displacement with time of a body executing (i) free oscillation (ii) damped oscillations.
View Solution