Construct a frequency distribution table for the data on weights ( in kg.) of 20 students of a class using intervals 30-35,35-40 and so on.
40,38,33,48,60,53,31,46,34,36,49,41,55,49,65,42,44,47,38,39.Solution in Punjabi
Step by step video & image solution for Construct a frequency distribution table for the data on weights ( in kg.) of 20 students of a class using intervals 30-35,35-40 and so on.40,38,33,48,60,53,31,46,34,36,49,41,55,49,65,42,44,47,38,39. by Maths experts to help you in doubts & scoring excellent marks in Class 8 exams.
Updated on:21/07/2023Topper's Solved these Questions
- DATA HANDLINGBOOK - SWAN PUBLICATIONCHAPTER - DATA HANDLINGEXERCISE - Exercise 5.1
12 Videos
- DATA HANDLINGBOOK - SWAN PUBLICATIONCHAPTER - DATA HANDLINGEXERCISE - Exercise 5.2
11 Videos
- DATA HANDLINGBOOK - SWAN PUBLICATIONCHAPTER - DATA HANDLINGEXERCISE - Think, Discuss And Write
7 Videos
- CUBES AND CUBE ROOTS BOOK - SWAN PUBLICATIONCHAPTER - CUBES AND CUBE ROOTS EXERCISE - EXERCISE 7.2
9 Videos
- DIRECT AND INVERSE PROPORTIONS BOOK - SWAN PUBLICATIONCHAPTER - DIRECT AND INVERSE PROPORTIONS EXERCISE - Exercise 13.2
16 Videos
Similar Questions
For which of these would you use a histogram to show the data : The number of letters for different areas in a postman’s bag. Give reasons for each
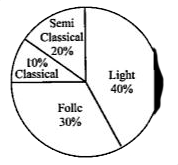
View SolutionA survey was made to find the type of music that a certain group of young people liked in a city. Adjoining pie chart shows the findings of this survey.

Find this pie chart answer the following
(i) If 20 people liked classical music, how many young people were surveyed?
(ii) Which type of music is liked by the maximum number of people?
(iii) If a cassette company were to make 1000 CD's how many of each type would they make?
View SolutionIf we change the position of any of the bars of a bar graph, would it change the information being conveyed ? Why ?
View SolutionFind the cube root of each of the following numbers by prime factorisation method : 175616
View SolutionWhich of the following are in inverse proportion : The number of workers on a job and the time to complete the job.
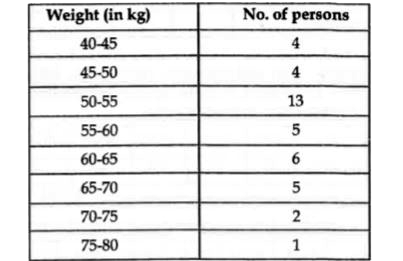
View SolutionThe following is the distribution of weights (in kg) of 40 persons.

Construct a cumulative frequency distribution (of the less than type) table for the data above.
View SolutionGiven below are the marks obtained by 30 students of a class, Using the class intervals of equal class size in which one class interval is 30-40 (excluding 40), construct a frequency table.
427439484280353852813172655877827965473064563948606372504635
View SolutionFollowing are the marks obtained by 30 students in a examination

Taking class intervals 0−10,10−20,…..40−50 construct a frequency table.
View Solutionअंतरालों 30−35,30−40 इत्यादि का प्रयोग करते हए, एक कक्षा के 20 विद्यार्थिओं के भारों (kg में) के निम्नलिखित आंकड़ों के लिए एक बारंबारता बंटन सारणी बनाइए :
40,38,33,48,60,53,31,46,34,36,49,41,55,49,65,42,44,47,38,39
View Solution30 छात्रों के एक परीक्षा के प्राप्तांक निम्नलिखित हैं :

वर्ग अन्तराल 0-10, 10-20,……,40-50 लेकर बारम्बारता सारणी बनाइए |
View SolutionThe weights (in kg) of 30 students of a class are
39,43,32,37,29,26,31,45, 46,31,37,38,30,39,36,41,35,34,41,46,39,38,36,38,40,42,33,43,44,33.
Prepare a frequency distribution table using one class interval as 30-35 in which 30 is included and 35 excluded. using the above data, draw a histogram.
View SolutionThe following is the distribution of weight (in kg) of 40 persons. Construct a cumulative frequency distribution (of less-than type). Table for the data:

View SolutionThe following is the distribution of weights (in kg) of 40 persons.

Construct a cumulative frequency distribution (of the less than type) table for the data above.
View Solution40 व्यक्तियों के भारों में (kg में) का बंटन निम्नलिखित है:

उपरोक्त आंकड़ों के लिए से कम प्रकार की एक संचयी बारंबारता बंटन सारणी की रचना कीजिए।
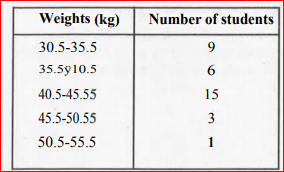
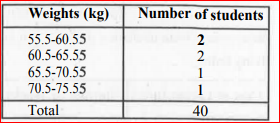
View SolutionConsider the following frequency distribution table representing the weights of 40 students of a class .

 Draw a histogram to represent the above data.
View SolutionConstruct a frequency distribution table for the data on weights (in kg) of 20 studetns of a class using intervals 30-35, 35-40 and so on.
40,38, 33, 48, 53, 46, 34, 36, 49, 41, 55, 49, 65, 42, 44, 47, 38, 39.
View Solution
