Given here is a bar graph showing the number of cycles produced in a factory during five consecutive weeks.
Observe the graph and answer the questions based on this graph.
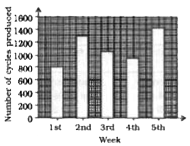
The number of cycles produced in the 5th week is
1060
1980
920
1900
The correct Answer is:B
Step by step video & image solution for Given here is a bar graph showing the number of cycles produced in a factory during five consecutive weeks. Observe the graph and answer the questions based on this graph. The number of cycles produced in the 5th week is by Maths experts to help you in doubts & scoring excellent marks in Class 14 exams.
Topper's Solved these Questions
- BOOK - KIRAN PUBLICATIONCHAPTER - STATISTICS AND DATA INTERPRETATIONEXERCISE - TYPE-III39videos
STATISTICS AND DATA INTERPRETATION
- BOOK - KIRAN PUBLICATIONCHAPTER - STATISTICS AND DATA INTERPRETATIONEXERCISE - TYPE-IV182videos
STATISTICS AND DATA INTERPRETATION
- BOOK - KIRAN PUBLICATIONCHAPTER - STATISTICS AND DATA INTERPRETATIONEXERCISE - TYPE-VIII8videos
STATISTICS AND DATA INTERPRETATION
- BOOK - KIRAN PUBLICATIONCHAPTER - SIMPLIFICATIONEXERCISE - TEST YOURSELF25videos
SIMPLIFICATION
- BOOK - KIRAN PUBLICATIONCHAPTER - TIME AND DISTANCEEXERCISE - Type -XI74videos
TIME AND DISTANCE
Similar Questions
The bar graph shows the number of toys produced by a factory during a certain week.
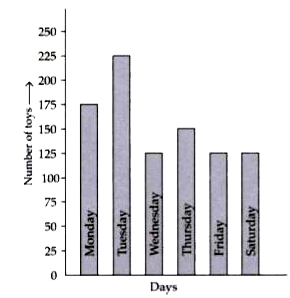
What is the total number of toys produced during the week ?View SolutionThe pictograph shows the number of bicycles made by a factory during the four weeks of a month. Answer the following questions.
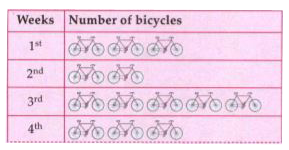

In which week maximum number of bicycles were made ?View Solution
Knowledge Check
- Question 1 - Select One
Given below is the bar graph showig the number of scooters produced in a factory during the first five months of a year.
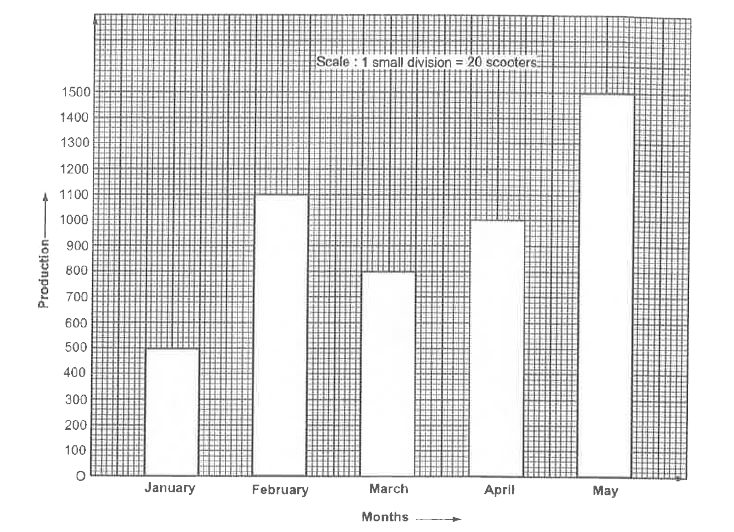
Read the above bar graph carefully nd answer the question given below:
How many scooters were produced in the month of March?
What was the increase in proudction in Feberuary over the production in January ?
What was teh decrease in proudction in March in comparison to the production in February ?
In which month was the production minimum and what was it ?A(i) 800 scooters
(ii) 600 scooters
(iii) 300 scooters less in March
(iv) Minimum production in january =500B(i) 700 scooters
(ii) 500 scooters
(iii) 300 scooters less in March
(iv) Minimum production in january =500C(i) 900 scooters
(ii) 600 scooters
(iii) 300 scooters less in March
(iv) Minimum production in january =200D(i) 750 scooters
(ii) 550 scooters
(iii) 300 scooters less in March
(iv) Minimum production in january =500 - Question 2 - Select One
The bar graph, given here, shows the number of tickets sold by 6 students A, B, C, D, E and F during a fair. Observe the graph and answer questions based on it.
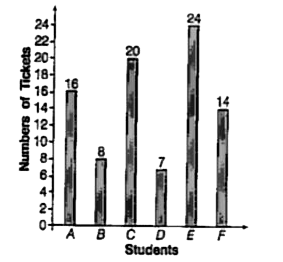
The least number of tickets were sold byABBFCADD - Question 3 - Select One
The bar graph, given here, shows the number of tickets sold by 6 students A, B, C, D, E and F during a fair. Observe the graph and answer questions based on it.
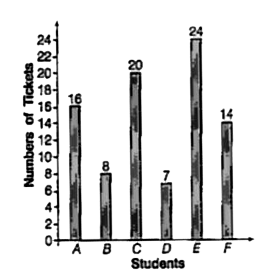
Total number of tickets sold by A, B and C isA45B44C42D40
Observe the graph and answer the following questions.
The information given by the graph is:
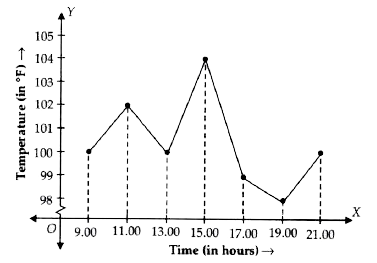 View Solution
The pictograph shows the number of bicycles made by a factory during the four weeks of a month. Answer the following questions.
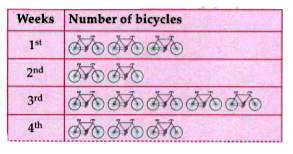

What is the difference between the number of bicycles made during 3rd week and 4th week ?View SolutionRead the bar graph which shows the number of books sold by a bookstore during five consecutive years and answer the following questions
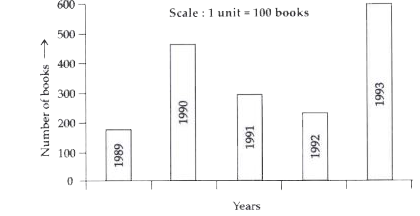
Can you give an appropriate name to the bar graph shown above ?View SolutionA bar graph showing the heights of six mountain peaks is given below. Study the bar graph and answer the questions.
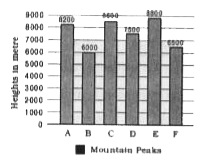
Which peak is the second highest ?View SolutionThe bar graph, given here, shows the number of tickets sold by 6 students A, B, C, D, E and F during a fair. Observe the graph and answer questions based on it.
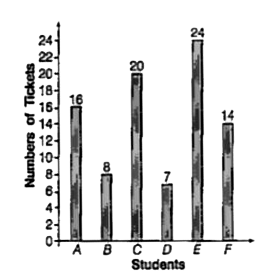
Total number of tickets sold by D, E and F isView Solution
