Study the following bar-diaggram carefully and answer the questions. The bar graph given below shows the foreign exchange reserve of a country (in million US $) from 1991-1992 to 1998-1999.
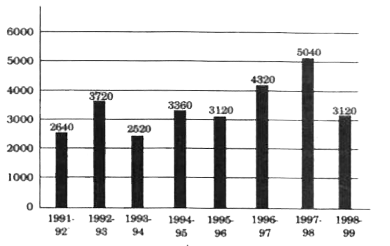
The ratio of the number of years, in which the foreign exchange reserves are above the average reserves, to those in which the reserves is
a)2:6
b)3:4
c)3:5
d)4:4
The correct Answer is:C
Step by step video & image solution for Study the following bar-diaggram carefully and answer the questions. The bar graph given below shows the foreign exchange reserve of a country (in million US $) from 1991-1992 to 1998-1999. The ratio of the number of years, in which the foreign exchange reserves are above the average reserves, to those in which the reserves is by Maths experts to help you in doubts & scoring excellent marks in Class 14 exams.
Updated on:21/07/2023Topper's Solved these Questions
- STATISTICS AND DATA INTERPRETATIONBOOK - KIRAN PUBLICATIONCHAPTER - STATISTICS AND DATA INTERPRETATIONEXERCISE - TYPE-III
39 Videos
- STATISTICS AND DATA INTERPRETATIONBOOK - KIRAN PUBLICATIONCHAPTER - STATISTICS AND DATA INTERPRETATIONEXERCISE - TYPE-IV
182 Videos
- STATISTICS AND DATA INTERPRETATIONBOOK - KIRAN PUBLICATIONCHAPTER - STATISTICS AND DATA INTERPRETATIONEXERCISE - TYPE-VIII
8 Videos
- SIMPLIFICATIONBOOK - KIRAN PUBLICATIONCHAPTER - SIMPLIFICATIONEXERCISE - TEST YOURSELF
25 Videos
- TIME AND DISTANCEBOOK - KIRAN PUBLICATIONCHAPTER - TIME AND DISTANCEEXERCISE - Type -XI
74 Videos
Similar Questions
Study the following bar-diaggram carefully and answer the questions. The bar graph given below shows the foreign exchange reserve of a country (in million US $) from 1991-1992 to 1998-1999.
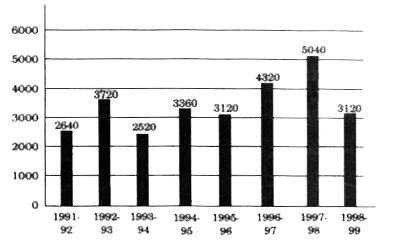
The percentage increase in the foreign exchange reserves in 1997-98 over 1993-94 is
View SolutionStudy the following bar-diaggram carefully and answer the questions. The bar graph given below shows the foreign exchange reserve of a country (in million US $) from 1991-1992 to 1998-1999.
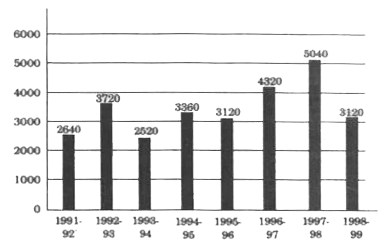
The foreign exchange reserves in 1996-97 were approximately what percent of the average foreign exchange reservesw over the period under review ?
View Solution
Knowledge Check
Study the following graph carefully and answer the question given below-----
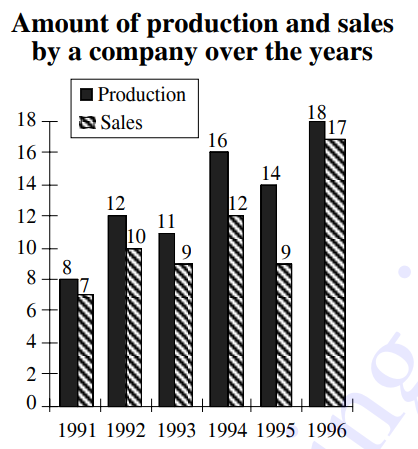
What was the percentage drop in sales from 1992 to 1993 ?A1B10C20D15Study the following bar hraph carefully and answer the questions.
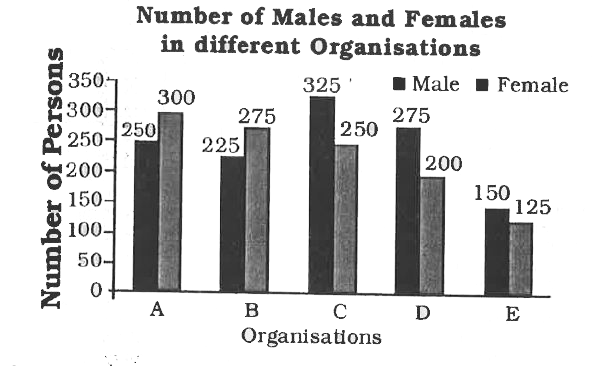
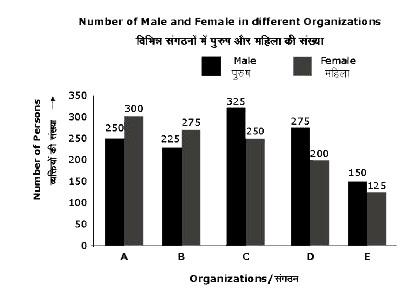
In the given bar graph, what is the average number of females in all five organisations?A245B235C230D225Study the following graph carefully and answer the questions given below it -----
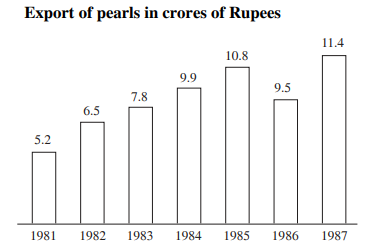
In how many years was the export above the average for the given period ?A2B3C4D5
Study the following bar-diagram carefully and answer the questions.
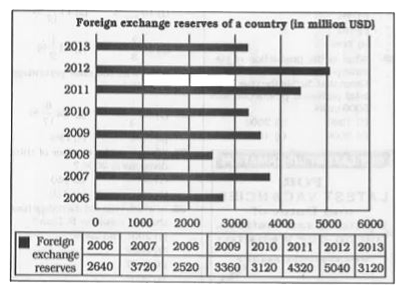
The ratio of the number of years, in which the foreign exchange reserves are above the average reserves, to those in which reserves it is less, is
View SolutionStudy the following bar-diagram carefully and answer the questions.
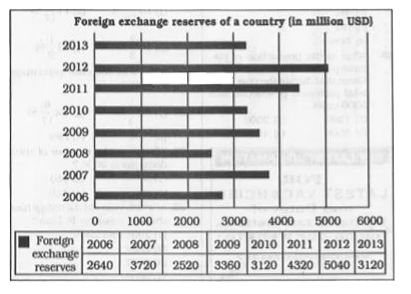
The foreign exchange reserve in 2012 was how many times that in 2009?
View SolutionStudy the following bar-diagram carefully and answer the questions.
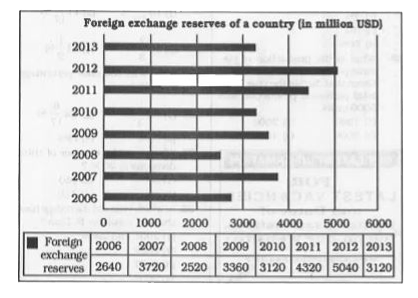
What was the percentage increase in the foreign reserve in 2012 over 2008?
View SolutionStudy the following bar-graph carefully and answer the question:
The average export of pearls for the given period (in crores Rs) is
View SolutionIn the given bar graph, what is the ratio of the total males and females working in all organisation.
View Solution
