Following table gives about the percentage change of the population in a particular town for given years. Go through the chart given and answer the questions that follow :
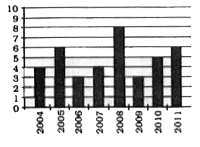
How many years witnessed a decrease in population across all the given years ?
1
2
3
0
The correct Answer is:D
Step by step video, text & image solution for Following table gives about the percentage change of the population in a particular town for given years. Go through the chart given and answer the questions that follow : How many years witnessed a decrease in population across all the given years ? by Maths experts to help you in doubts & scoring excellent marks in Class 14 exams.
Topper's Solved these Questions
- BOOK - KIRAN PUBLICATIONCHAPTER - STATISTICS AND DATA INTERPRETATIONEXERCISE - TYPE-III39videos
STATISTICS AND DATA INTERPRETATION
- BOOK - KIRAN PUBLICATIONCHAPTER - STATISTICS AND DATA INTERPRETATIONEXERCISE - TYPE-IV182videos
STATISTICS AND DATA INTERPRETATION
- BOOK - KIRAN PUBLICATIONCHAPTER - STATISTICS AND DATA INTERPRETATIONEXERCISE - TYPE-VIII8videos
STATISTICS AND DATA INTERPRETATION
- BOOK - KIRAN PUBLICATIONCHAPTER - SIMPLIFICATIONEXERCISE - TEST YOURSELF25videos
SIMPLIFICATION
- BOOK - KIRAN PUBLICATIONCHAPTER - TIME AND DISTANCEEXERCISE - Type -XI74videos
TIME AND DISTANCE
Similar Questions
A table showing the percentage of the total population of a State by age groups for the year 1991 is given below. Answer the questions given below it.
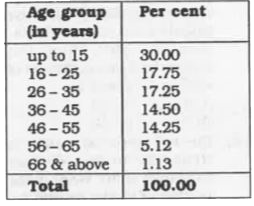
Which age group accounts for the maximum population in the State ?View SolutionIf the population of a town increased every year by 2.1% of the population at the beginning of that year,in how many years will the total increase of population be 20%
View Solution
Knowledge Check
- Question 1 - Select One
Following table givesd about the percentage change of the population in a particular town for given years. Go through the chart given and answer the questions that follow :
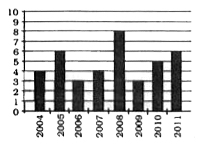
Which year out of these 8 years ahs the highest population ?A2008B2005C2010D2011 - Question 2 - Select One
Following table givesd about the percentage change of the population in a particular town for given years. Go through the chart given and answer the questions that follow :
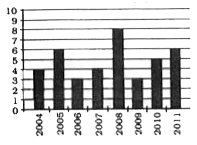
What was the population of the town in year 2009 ?A3B5C4DCan not determined - Question 3 - Select One
Following table givesd about the percentage change of the population in a particular town for given years. Go through the chart given and answer the questions that follow :
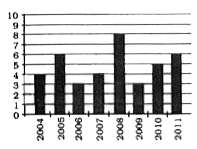
What is the percentage increase in population of the town from 2005 to 2008 ?AA)19%BB)33.33%CC)22.6%DD)Can not determined
A table showing the percentage of the total population of a State by age groups for the year 1991 is given below. Answer the questions given below it.
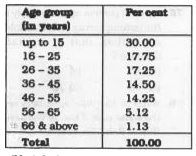
Which age group accounts for the maximumn population in the State?View SolutionStudy the bar chart given below and answer the following questions :
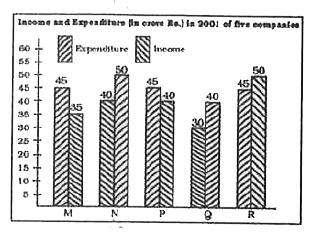
The company earning the maximum percentage of profit in the year 2001 is :View SolutionStudy the following graph carefully and answer the questions given below it -----
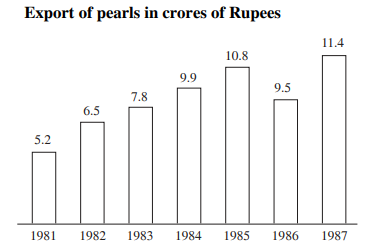
In how many years was the export above the average for the given period ?View SolutionStudy the following graph carefully and answer the questions that
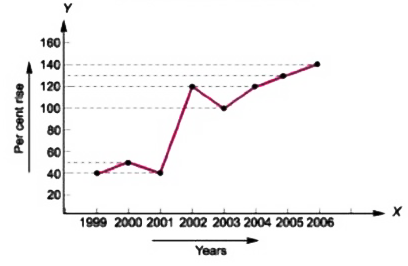
For how many years , the percent rise was lower than the average of the percent rise over the given years ?View SolutionStudy the following graph carefully and answer the questions that
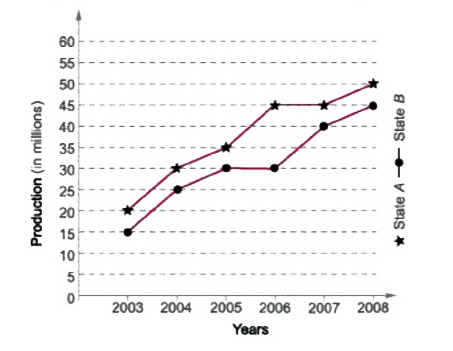
Population of State A in 2005 was what percent of its total population for all the years together ?View Solution

