Study the bar diagram and answer the following questions.
The bar diagram shows the number of bicycles parked in the parking space of a hall at various points of time.
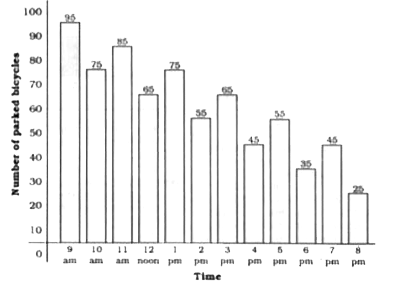
How many times, as mentioned in the graph, is the number of parked cycles above average ?
3
4
5
6
The correct Answer is:D
Step by step video & image solution for Study the bar diagram and answer the following questions. The bar diagram shows the number of bicycles parked in the parking space of a hall at various points of time. How many times, as mentioned in the graph, is the number of parked cycles above average ? by Maths experts to help you in doubts & scoring excellent marks in Class 14 exams.
Updated on:21/07/2023Topper's Solved these Questions
- STATISTICS AND DATA INTERPRETATIONBOOK - KIRAN PUBLICATIONCHAPTER - STATISTICS AND DATA INTERPRETATIONEXERCISE - TYPE-III
39 Videos
- STATISTICS AND DATA INTERPRETATIONBOOK - KIRAN PUBLICATIONCHAPTER - STATISTICS AND DATA INTERPRETATIONEXERCISE - TYPE-IV
182 Videos
- STATISTICS AND DATA INTERPRETATIONBOOK - KIRAN PUBLICATIONCHAPTER - STATISTICS AND DATA INTERPRETATIONEXERCISE - TYPE-VIII
8 Videos
- SIMPLIFICATIONBOOK - KIRAN PUBLICATIONCHAPTER - SIMPLIFICATIONEXERCISE - TEST YOURSELF
25 Videos
- TIME AND DISTANCEBOOK - KIRAN PUBLICATIONCHAPTER - TIME AND DISTANCEEXERCISE - Type -XI
74 Videos
Similar Questions
Study the bar diagram and answer the following questions.
The bar diagram shows the number of bicycles parked in the parking space of a hall at various points of time.
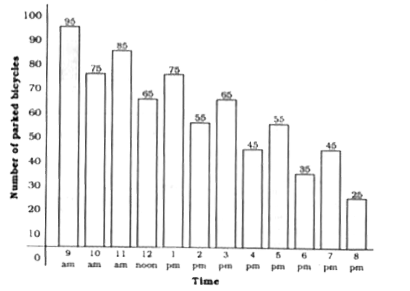
What is the percentage decrease in the number of parked cycles between 7 pm and 8 pm? (in whole number)
View SolutionStudy the bar diagram and answer the following questions.
The bar diagram shows the number of bicycles parked in the parking space of a hall at various points of time.
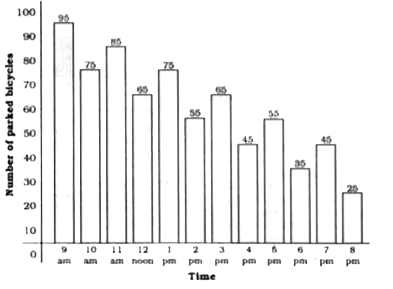
What is the average number fo parked cycles as seen from the graph ?
View Solution
Knowledge Check
Study the bar diagram and answer the questions.
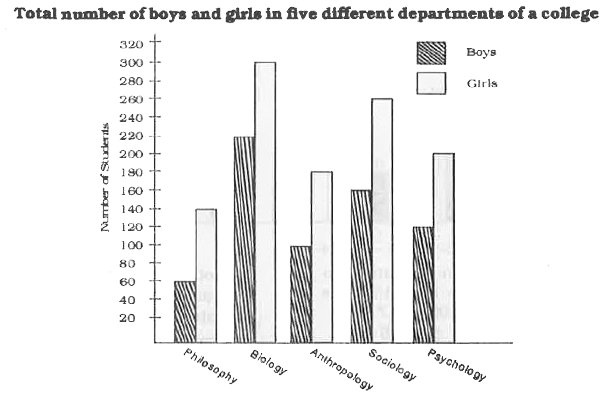
The average number of boys from all the departments together isA123B132C134D142Study the bar diagram and answer the questions.
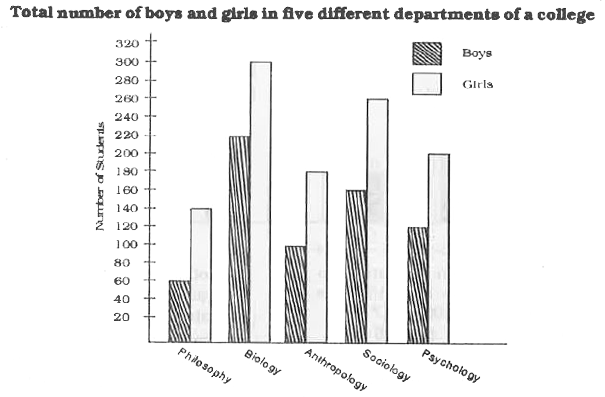
The difference between the total number of bys and the total number of girls from all the Departments together isA540B520C460D440Study the given Venn diagram carefully and answer the following question .
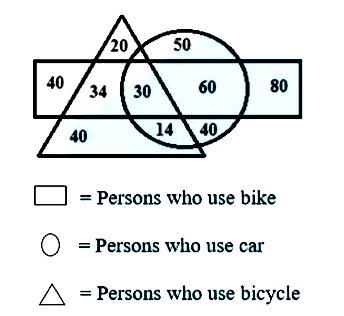
How many persons use both a bicycle and a bike but not a car ?A30B14C34D40
Study the bar diagram and answer the following questions.
The bar diagram shows the number of bicycles parked in the parking space of a hall at various points of time.
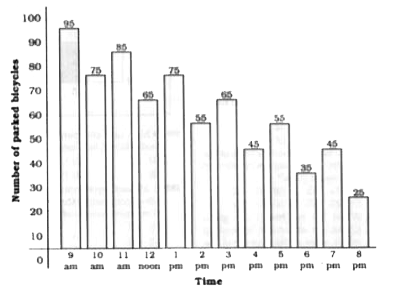
The charges for parking is Rs. 1 per hour. What will be the total collection from 9 am to 7 pm?
View SolutionStudy the given Venn diagram carefully and answer the following question.
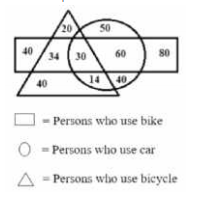 How many persons use both a bicycle and a bike but not a car?
View SolutionLook at the bar graph and answer the following questions.
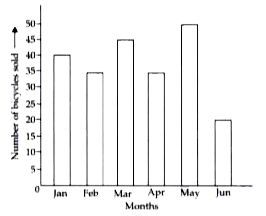
How many less bicycles sold in June than in March?
View SolutionStudy the double bar graph given below and answer the questions.

The average of the number of students participating in exhibition is
View SolutionStudy the double bar graph given below and answer the questions.

The average of the number of students participating in cultural events is
View Solution
