The bar diagram shows the monthly expenditure of a company. Study the graph and answer the questions.
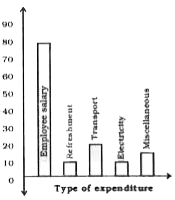
The total monthly expenditure of the company is :
Rs. 153 lakhs
Rs. 315 lakhs
Rs. 135 lakhs
Rs. 531 lakhs
The correct Answer is:C
Step by step video, text & image solution for The bar diagram shows the monthly expenditure of a company. Study the graph and answer the questions. The total monthly expenditure of the company is : by Maths experts to help you in doubts & scoring excellent marks in Class 14 exams.
Updated on:21/07/2023Topper's Solved these Questions
- STATISTICS AND DATA INTERPRETATIONBook:KIRAN PUBLICATIONChapter:STATISTICS AND DATA INTERPRETATIONExercise:TYPE-III
Explore 39 Videos
- STATISTICS AND DATA INTERPRETATIONBook:KIRAN PUBLICATIONChapter:STATISTICS AND DATA INTERPRETATIONExercise:TYPE-IV
Explore 182 Videos
- STATISTICS AND DATA INTERPRETATIONBook:KIRAN PUBLICATIONChapter:STATISTICS AND DATA INTERPRETATIONExercise:TYPE-VIII
Explore 8 Videos
- SIMPLIFICATIONBook:KIRAN PUBLICATIONChapter:SIMPLIFICATIONExercise:TEST YOURSELF
Explore 25 Videos
- TIME AND DISTANCEBook:KIRAN PUBLICATIONChapter:TIME AND DISTANCEExercise:Type -XI
Explore 74 Videos
Similar Questions
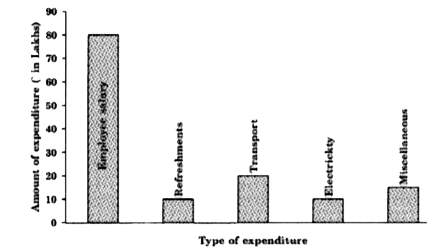
The graph shows the monthly expenditure of a company (unit = 10 lakhs). Study the graph and answer the questions :
The total monthly expenditure of the company is :
ग्राफ में किसी कम्पनी के मासिक व्यय को दर्शाया गया है। ग्राफ का अध्ययन कीजिए और निम्नलिखित प्रश्नों के उत्तर दीजिए।
कम्पनी का कुल मासिक व्यय कितना है ?
View SolutionThe give graph represents the percentage distibution of the total expenditure of a company. Study the graph and answer the question that follows .
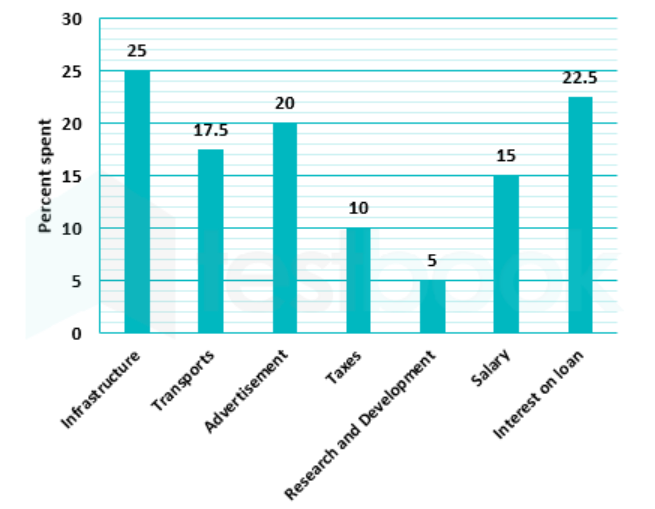
The total expenditure of the company is how many times the total expenditure on 'Research and Development' and 'Salary'?
View Solution
Knowledge Check
The bar diagram shows the monthly expenditure of a company. Study the graph and answer the questions.
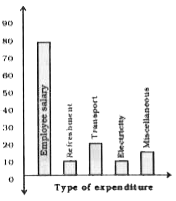
The ratio between expenditure on transport and employees salary on monthly basis is :A1:4B4:3C3:4D4:1The bar diagram shows the monthly expenditure of a company. Study the graph and answer the questions.
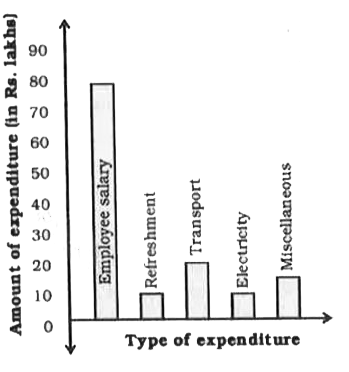
The ratio between expenditure on transport and employee salary on monthly basis is :A1:4B4:3C3:4D4:1The bar diagram shows the monthly expenditure of a company. Study the graph and answer the questions.
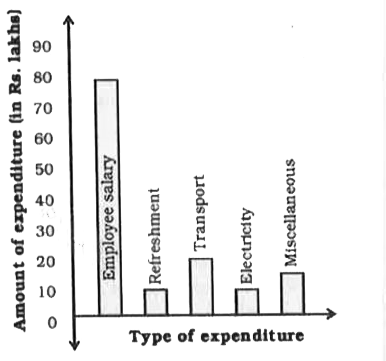
The fraction of money spent on refreshment is:A1312B227C110D10
The graph shows Income and Expenditure of a company. Study the graph and answer the questions.
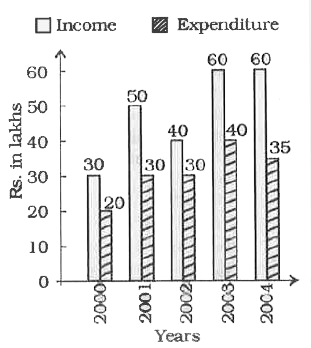
The profit was maximum in the year
View SolutionThe graph shows Income and Expenditure of a company. Study the graph and answer the questions.
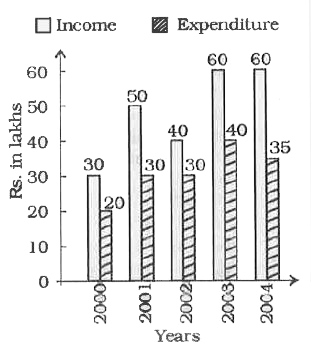
The income in 2002 was equal to the expenditure in the year
View SolutionThe bar diagram shows the monthly expenditure of a company. Study the graph and answer the questions.
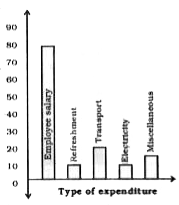
The fraction of money spent on refreshment is :
View SolutionThe bar diagram shows the monthly expenditure of a company. Study the graph and answer the questions.
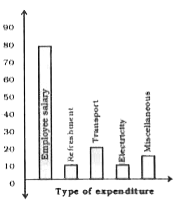
The percentage of money spent on miscellaneous is
View SolutionThe bar diagram shows the monthly expenditure of a company. Study the graph and answer the questions.
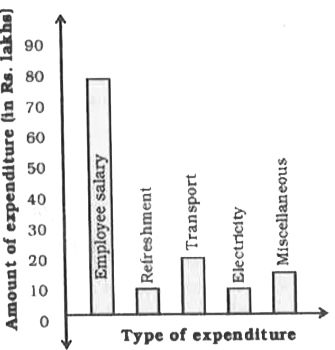
The percentage of money spent on miscellaneous is
View Solution