Study the following bar graph carefully to answer the questions.
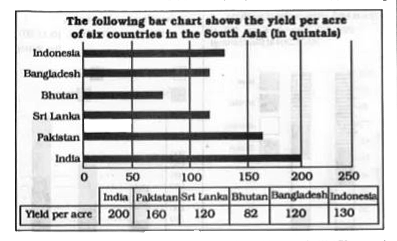
If the yield per arce is arranged in ascending order, then what is the difference between the yield per arce of first three countries and last the three countries?
168 quintals
172 quintals
182 quintals
190 quintals
The correct Answer is:A
Step by step video & image solution for Study the following bar graph carefully to answer the questions. If the yield per arce is arranged in ascending order, then what is the difference between the yield per arce of first three countries and last the three countries? by Maths experts to help you in doubts & scoring excellent marks in Class 14 exams.
Updated on:21/07/2023Topper's Solved these Questions
- STATISTICS AND DATA INTERPRETATIONBOOK - KIRAN PUBLICATIONCHAPTER - STATISTICS AND DATA INTERPRETATIONEXERCISE - TYPE-IV
182 Videos
- STATISTICS AND DATA INTERPRETATIONBOOK - KIRAN PUBLICATIONCHAPTER - STATISTICS AND DATA INTERPRETATIONEXERCISE - TYPE-V
38 Videos
- STATISTICS AND DATA INTERPRETATIONBOOK - KIRAN PUBLICATIONCHAPTER - STATISTICS AND DATA INTERPRETATIONEXERCISE - TYPE-II
131 Videos
- SIMPLIFICATIONBOOK - KIRAN PUBLICATIONCHAPTER - SIMPLIFICATIONEXERCISE - TEST YOURSELF
25 Videos
- TIME AND DISTANCEBOOK - KIRAN PUBLICATIONCHAPTER - TIME AND DISTANCEEXERCISE - Type -XI
74 Videos
Similar Questions
Study the following bar graph carefully to answer the questions.
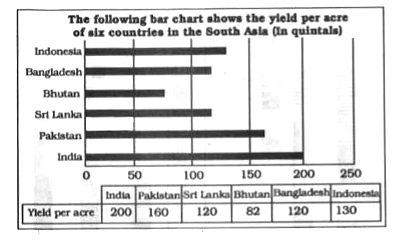
The yield per acre of India is what percent more than that of Pakistan?
View SolutionStudy the following bar graph carefully to answer the questions.
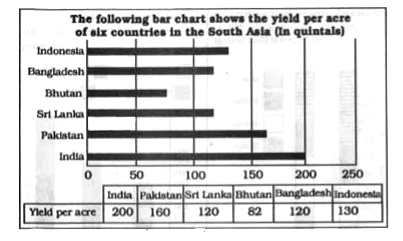
The yield per acre produced by Bangladesh is what percent of the total yield per arce produced by all countires?
View Solution
Knowledge Check
Study the following graph carefully to answer these questions-
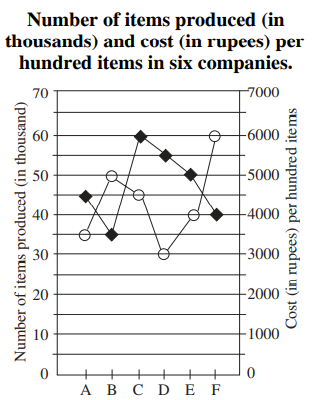
What is the average cost per hundred items for all the given companies?ARs. 4183 23BRs. 4184 13CRs. 433 23DNone of theseStudy the following graph carefully and answer these questions :-
Expenditure and profit percent of a company in different years
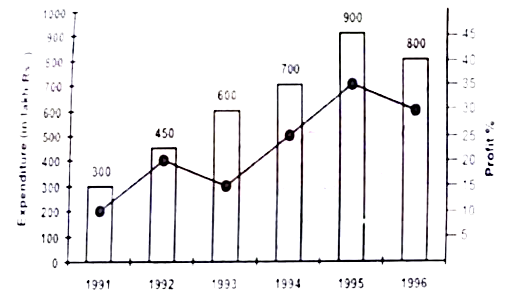
What is the difference between the income of year 1995 and 1993 ?ARs. 460 lakhsBRs. 525 lakhsCRs. 540 lakhsDRs. 580 lakhsStudy the following graph carefully and answer the following questions -----
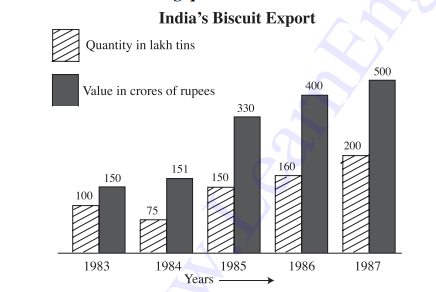
In which year the value per tins was minimum ?A1983B1984C1985D1986
Study the following bar-graph carefully and answer the question:
The average export of pearls for the given period (in crores Rs) is
View SolutionStudy the following graph carefully and answer the given questions.
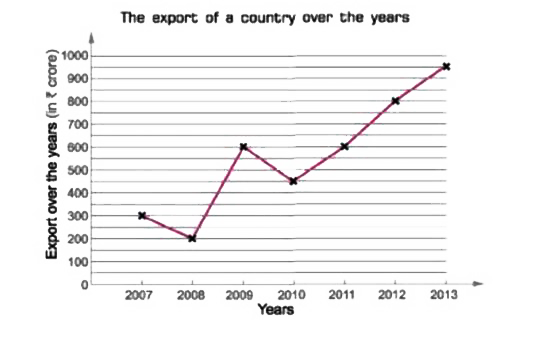
What is the difference in exports in the years 2009 and 2010 ?
View SolutionStudy the following multiple bar graph carefully and answer the questions.
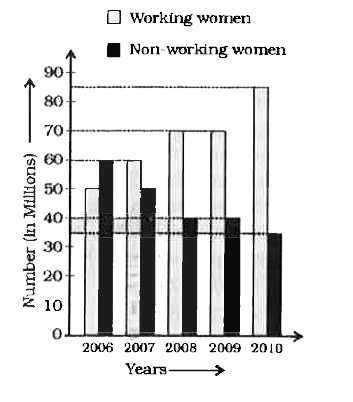
In which year or years, the difference between the number of working and non-working women the lowest ?
View SolutionStudy the following graph carefully and answer the questions that follow
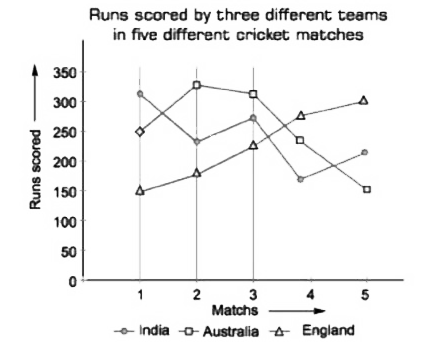
What are the average runs scored by all the three teams in Match 3 together ?
View SolutionStudy the following bar hraph carefully and answer the questions.
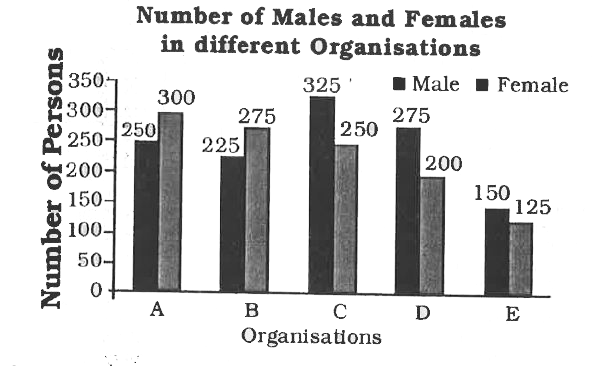
In the given bar graph, what is the average number of females in all five organisations?
View Solution
