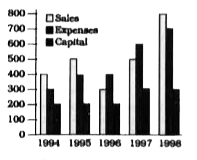
The following graph gives Sales, Expenses and Capital of a company for a period of five years 1994 to 1998. Read the graph and answer the following questions.
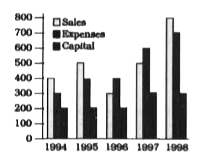
What was the average per annum increase in sales (in Rs cr.) from 1994 to 1998 ?
50
60
80
100
The correct Answer is:C
Step by step video, text & image solution for The following graph gives Sales, Expenses and Capital of a company for a period of five years 1994 to 1998. Read the graph and answer the following questions. What was the average per annum increase in sales (in Rs cr.) from 1994 to 1998 ? by Maths experts to help you in doubts & scoring excellent marks in Class 14 exams.
Topper's Solved these Questions
- BOOK - KIRAN PUBLICATIONCHAPTER - STATISTICS AND DATA INTERPRETATIONEXERCISE - TYPE-V38videos
STATISTICS AND DATA INTERPRETATION
- BOOK - KIRAN PUBLICATIONCHAPTER - STATISTICS AND DATA INTERPRETATIONEXERCISE - TYPE-VI86videos
STATISTICS AND DATA INTERPRETATION
- BOOK - KIRAN PUBLICATIONCHAPTER - STATISTICS AND DATA INTERPRETATIONEXERCISE - TYPE-III39videos
STATISTICS AND DATA INTERPRETATION
- BOOK - KIRAN PUBLICATIONCHAPTER - SIMPLIFICATIONEXERCISE - TEST YOURSELF25videos
SIMPLIFICATION
- BOOK - KIRAN PUBLICATIONCHAPTER - TIME AND DISTANCEEXERCISE - Type -XI74videos
TIME AND DISTANCE
Similar Questions
Study the graph and answer the questions.
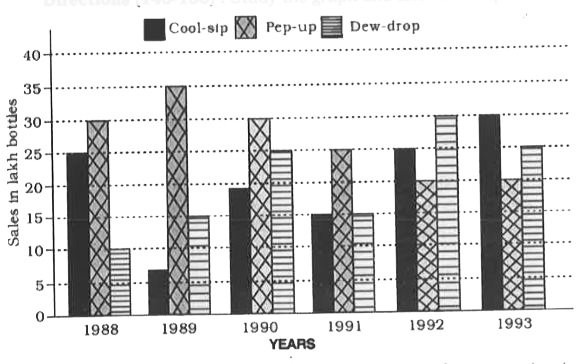
What was the approximate percent increase in sales of Cool - sip in 1990 over its sales in 1989 ? iView SolutionStudy the graph and answer the questions.
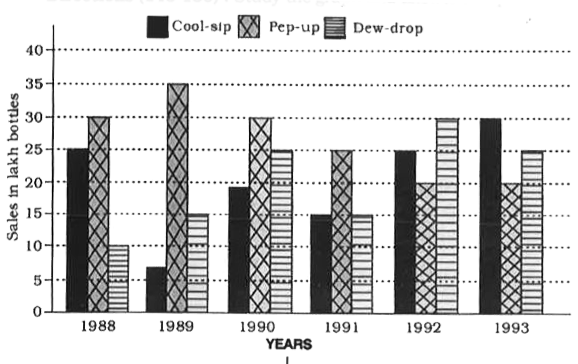
In case of which soft drink was the average annual sale maximum during the period 1988 - 1993 ?View Solution
Knowledge Check
- Question 1 - Select One
The following graph gives Sales, Expenses and Capital of a company for a period of five years 1994 to 1998. Read the graph and answer the following questions.
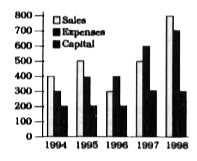
In which year was the Sales to Expense ratio the lowest?A1994B1996C1997D1998 - Question 2 - Select One
The following graph gives Sales, Expenses and Capital of a company for a period of five years 1994 to 1998. Read the graph and answer the following questions.
In which years was the ratio of sales tom capital the lowest ?A1998B1997C1996D1995 - Question 3 - Select One
The following graph gives Sales, Expenses and Capital of a company for a period of five years 1994 to 1998. Read the graph and answer the following questions.
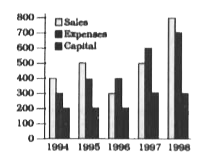
In which year was the ratio of profit to capital the highest?A1998B1995C1996D1997
Study the graph and answer the questions.
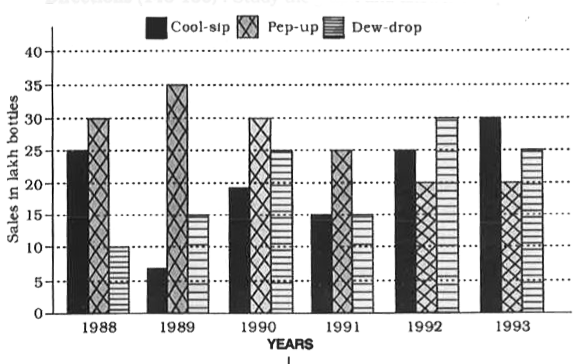
In case of which soft drink was the average annual sale minimum during the period 1988- 1993 ?View SolutionThe following graph gives Sales, Expenses and Capital of a company for a period of five years 1994 to 1998. Read the graph and answer the following questions.
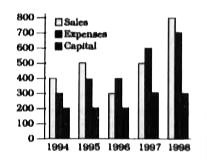
What has been the simple average growth rate per annum of expense between 1994 and 1998 ?View SolutionStudy the graph and answer the questions.

What was the approximate percent increase in sales of Cool - sip in 1990 over its sales in 1989 ? iView SolutionStudy the graph carefully and answer the following questions.
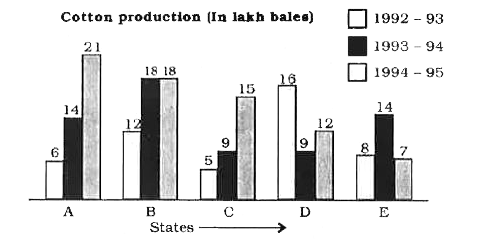
What is the average production of the four states in the year 1994-95 taken together ?View SolutionStudy the graph and answer the questions.

In case of which soft drink was the average annual sale minimum during the period 1988- 1993 ?View Solution

