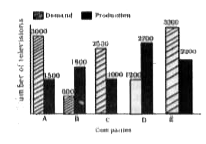
The bar graph, given here, shows the diamond and production of colour televisions of five companies for Diwali season in the year 2009. Study the graph carefully and answer the questions based on the graph.
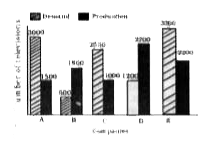
The ratio of the demand and production of colour televisions of company E is :
3:2
2:3
2:1
1:2
The correct Answer is:A
Step by step video & image solution for The bar graph, given here, shows the diamond and production of colour televisions of five companies for Diwali season in the year 2009. Study the graph carefully and answer the questions based on the graph. The ratio of the demand and production of colour televisions of company E is : by Maths experts to help you in doubts & scoring excellent marks in Class 14 exams.
Updated on:21/07/2023Topper's Solved these Questions
- STATISTICS AND DATA INTERPRETATIONBOOK - KIRAN PUBLICATIONCHAPTER - STATISTICS AND DATA INTERPRETATIONEXERCISE - TYPE-V
38 Videos
- STATISTICS AND DATA INTERPRETATIONBOOK - KIRAN PUBLICATIONCHAPTER - STATISTICS AND DATA INTERPRETATIONEXERCISE - TYPE-VI
86 Videos
- STATISTICS AND DATA INTERPRETATIONBOOK - KIRAN PUBLICATIONCHAPTER - STATISTICS AND DATA INTERPRETATIONEXERCISE - TYPE-III
39 Videos
- SIMPLIFICATIONBOOK - KIRAN PUBLICATIONCHAPTER - SIMPLIFICATIONEXERCISE - TEST YOURSELF
25 Videos
- TIME AND DISTANCEBOOK - KIRAN PUBLICATIONCHAPTER - TIME AND DISTANCEEXERCISE - Type -XI
74 Videos
Similar Questions
The bar graph, given here, shows the diamond and production of colour televisions of five companies for Diwali season in the year 2009. Study the graph carefully and answer the questions based on the graph.
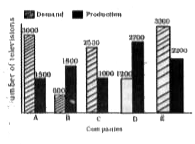
The demand of colour televisions of company B is approximately what per cent of that of company C ?
View SolutionThe following graph shows the demand and production of cotton by 5 companies A, B, C, D and E. Study the graph and answer question
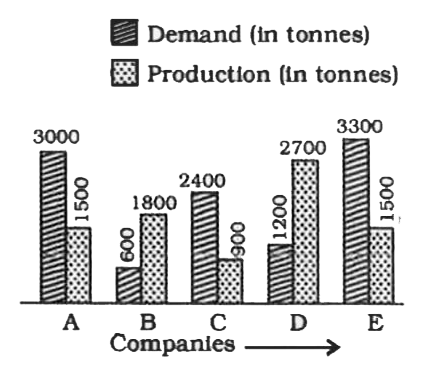
What is the ratio of companies having more demand than production to those having more production than demand?
View Solution
Knowledge Check
The bar graph, given here, shows the demand and production of colour televisions of five companies for Diwali season in the year 2009. Study the graph carefully and answer the questions based on the graph.
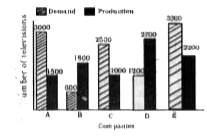
The ratio of companies having more demand than production of colour televisions to those having more production than demand is :A2:3B4:1C1:4D3:2The bar graph, given here, shows the diamond and production of colour televisions of five companies for Diwali season in the year 2009. Study the graph carefully and answer the questions based on the graph.
The production of colour televisions of company D is how many times that of company A ?A1.9B1.8C1.5D2.3Study the following graph carefully and answer the questions -----
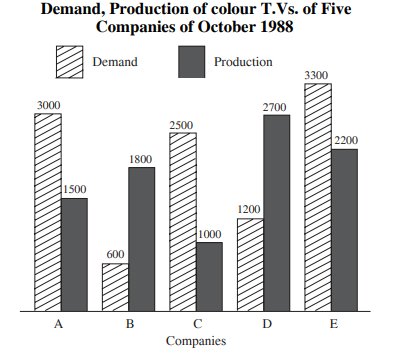
What is the ratio of companies having more demand than production to those having more production than demand ?A2 : 3B4 : 1C2 : 2D3 : 2
The following graph shows the production of wheat flour (in 1000 tonnes) by three companies X, Y and Z over the years. Study the graph and answer the questions.
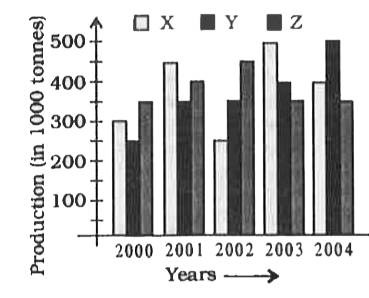
What is the ratio of the average production of company X in the period 2002-2004 to the average production of company Y in the same period ?
View SolutionThe bar graph given here shows the number of jobseekers of a state in various years at different stages of education.
Study the graph carefully and answer the question based on it.
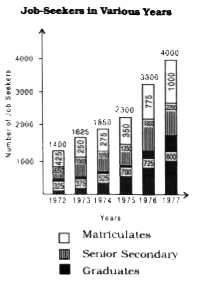
In which year, was the number of Matriculate job-seekers maximum ?
View SolutionStudy the following graph carefully and answer the questions -----
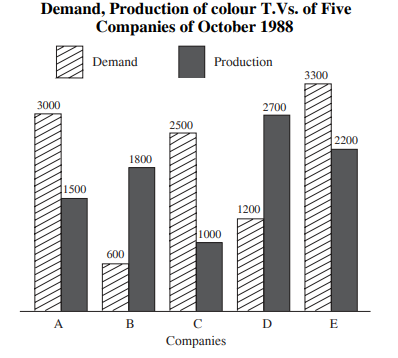
What is the difference between average demand and average production of the five companies taken together ?
View SolutionStudy the given bar graph carefully and answer the questions based on it.
Production (in lakh tonne) of wheat from 2005-10
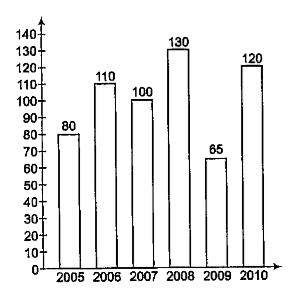
What is the mean production for all the years?
View SolutionThe following graph shows the production of wheat flour (in 1000 tonnes) by three companies X, Y and Z over the years. Study the graph and answer the questions.
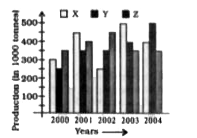
What is the ratio of the average production of company X in the period 2002-2004 to the average production of company Y in the same period ?
View Solution
