A constituency is divided in four regions A, B, C and D. Two candidates X and Y contested last election from that constituency. The adjoining graph given the break-up of voting in the four regions. Study the graph and answer the following questions.
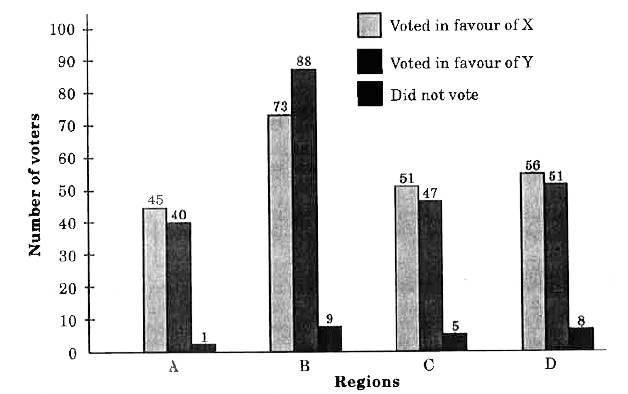
Approximately how much percent of voters voted in favour of X?
45.4
47.5
50
225
The correct Answer is:B
Step by step video, text & image solution for A constituency is divided in four regions A, B, C and D. Two candidates X and Y contested last election from that constituency. The adjoining graph given the break-up of voting in the four regions. Study the graph and answer the following questions. Approximately how much percent of voters voted in favour of X? by Maths experts to help you in doubts & scoring excellent marks in Class 14 exams.
Topper's Solved these Questions
- BOOK - KIRAN PUBLICATIONCHAPTER - STATISTICS AND DATA INTERPRETATIONEXERCISE - TYPE-V38videos
STATISTICS AND DATA INTERPRETATION
- BOOK - KIRAN PUBLICATIONCHAPTER - STATISTICS AND DATA INTERPRETATIONEXERCISE - TYPE-VI86videos
STATISTICS AND DATA INTERPRETATION
- BOOK - KIRAN PUBLICATIONCHAPTER - STATISTICS AND DATA INTERPRETATIONEXERCISE - TYPE-III39videos
STATISTICS AND DATA INTERPRETATION
- BOOK - KIRAN PUBLICATIONCHAPTER - SIMPLIFICATIONEXERCISE - TEST YOURSELF25videos
SIMPLIFICATION
- BOOK - KIRAN PUBLICATIONCHAPTER - TIME AND DISTANCEEXERCISE - Type -XI74videos
TIME AND DISTANCE
Similar Questions
Sales of books from four shops (B1, B2, B3, B4) in thousands are given as below. Study the graph and answer the following questions.
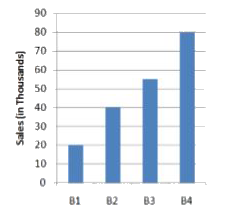
The average sales of book from shop B1, B2 and B4 is closest to:View SolutionSales of books from four shops (B1, B2, B3, B4) in thousands are given as below. Study the graph and answer the following questions.
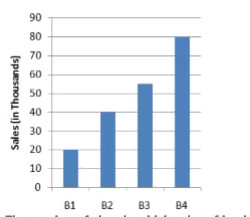
The number of shop in which sales of books are below the average level is:View Solution
Knowledge Check
- Question 1 - Select One
A constituency is divided in four regions A, B, C and D. Two candidates X and Y contested last election from that constituency. The adjoining graph given the break-up of voting in the four regions. Study the graph and answer the following questions.
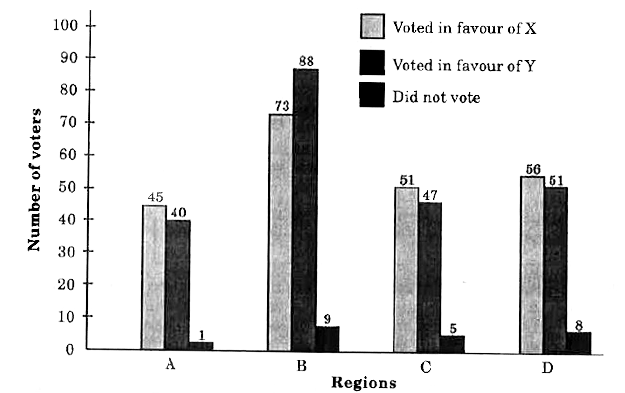
Approximately how much percent of voter did not caste their votes?A4.9B4.5C0.23D2.3 - Question 2 - Select One
A constituency is divided in four regions A,B,C and D . Two candidates X and Y contested the last election from that constituency . The adjoining graph gives the break - up of voting in the four regions . Study graph and answer the following questions .
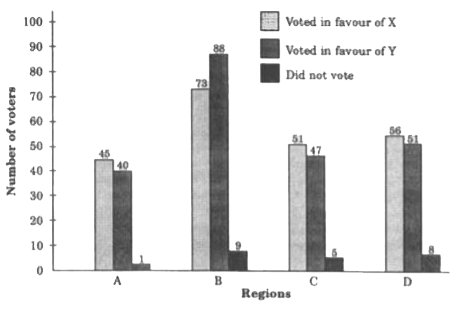
Approximately how much percent of voted in favour of X ?A45.4B47.5C50D225 - Question 3 - Select One
A constituency is divided in four regions A,B,C and D . Two candidates X and Y contested the last election from that constituency . The adjoining graph gives the break - up of voting in the four regions . Study graph and answer the following questions .

Approximately how much percent of voters did not caste their votes?A4.9B4.5C0.23D23
A constituency is divided in four regions A, B, C and D. Two candidates X and Y contested last election from that constituency. The adjoining graph given the break-up of voting in the four regions. Study the graph and answer the following questions.
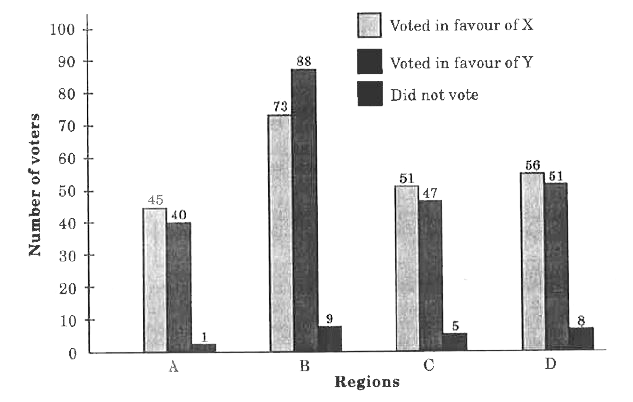
Nearly what percentage of his total votes did X receive from region B?View SolutionA constituency is divided in four regions A, B, C and D. Two candidates X and Y contested last election from that constituency. The adjoining graph given the break-up of voting in the four regions. Study the graph and answer the following questions.
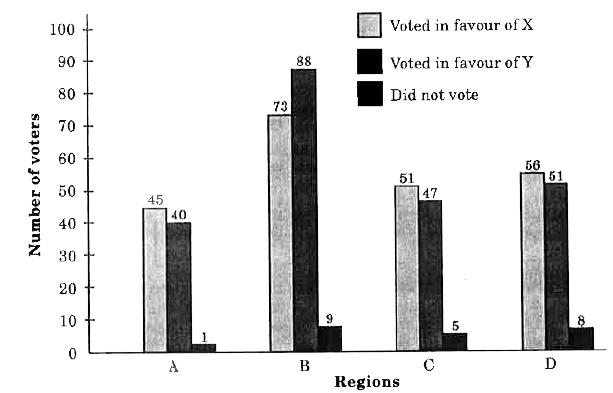
In region B, Y get A% more votes than X. Find the value of A.View SolutionA constituency is divided in four regions A,B,C and D . Two candidates X and Y contested the last election from that constituency . The adjoining graph gives the break - up of voting in the four regions . Study graph and answer the following questions .

Nearly what percentage of the total votes did X receive from region B ?View SolutionA constituency is divided in four regions A,B,C and D . Two candidates X and Y contested the last election from that constituency . The adjoining graph gives the break - up of voting in the four regions . Study graph and answer the following questions .
 In region B ,Y gets A% more votes than X , find the value of A. View Solution
The following graph shows the production of cotton bales of 100 kg each in lakhs by different states A, B, C, D and E over the years. Study the graph and answer the following Questions.
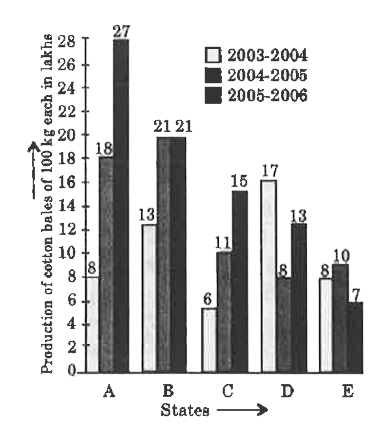
How many kg of cotton was produced by State C during the given period ?View Solution

