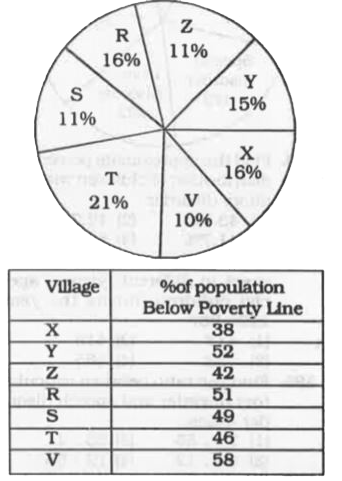
The following pie chart shows proportion of population of seven villages in 2009. Study the pie chart and answer the questions that follow :

In 2010, the population of 'Y' and 'V' increases by 10% each and the percentage of population below poverty line remains unchanged for all the villages. If in 2009, the population of villages Y was 30,000, then the below poverty line population of village 'V' in 2010 is ____
11250
12760
13140
13780
The correct Answer is:B
Step by step video, text & image solution for The following pie chart shows proportion of population of seven villages in 2009. Study the pie chart and answer the questions that follow : In 2010, the population of 'Y' and 'V' increases by 10% each and the percentage of population below poverty line remains unchanged for all the villages. If in 2009, the population of villages Y was 30,000, then the below poverty line population of village 'V' in 2010 is ____ by Maths experts to help you in doubts & scoring excellent marks in Class 14 exams.
Topper's Solved these Questions
- BOOK - KIRAN PUBLICATIONCHAPTER - STATISTICS AND DATA INTERPRETATIONEXERCISE - TYPE-VIII8videos
STATISTICS AND DATA INTERPRETATION
- BOOK - KIRAN PUBLICATIONCHAPTER - STATISTICS AND DATA INTERPRETATIONEXERCISE - TYPE-VI86videos
STATISTICS AND DATA INTERPRETATION
- BOOK - KIRAN PUBLICATIONCHAPTER - SIMPLIFICATIONEXERCISE - TEST YOURSELF25videos
SIMPLIFICATION
- BOOK - KIRAN PUBLICATIONCHAPTER - TIME AND DISTANCEEXERCISE - Type -XI74videos
TIME AND DISTANCE
Similar Questions
The population of a village increases continuously at the rate proportional to the number of its inhabitants present at any time. If the population of the village was 20, 000 in 1999 and 25000 in the year 2004, what will be the population of the village in 2009?
View SolutionThe population of a village increases continuously at the rate proportional to the number of its inhabitants present at any time. If the population of the village was 20,000 in 1999 and 25000 in the year 2004, what will be the population of the village in 2009?
View Solution
Knowledge Check
- Question 1 - Select One
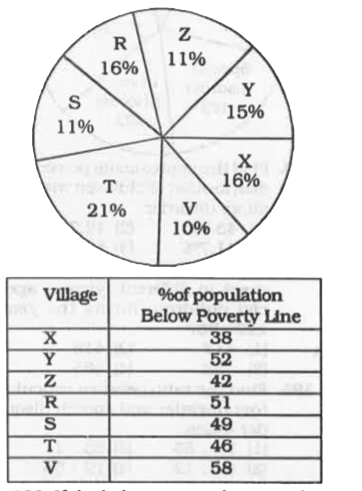
The following pie chart shows proportion of population of seven villages in 2009. Study the pie chart and answer the questions that follow :

If the population of the village 'R' is 32000, then the below poverty line population of village 'Y' isA14100B15600C16500D17000 - Question 2 - Select One
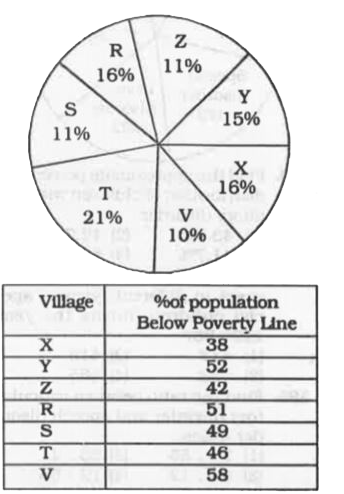
The following pie chart shows proportion of population of seven villages in 2009. Study the pie chart and answer the questions that follow :

If the below poverty line population of the village 'X' is 12160, then the population of village 'S' isA18500B20500C22000D20000 - Question 3 - Select One
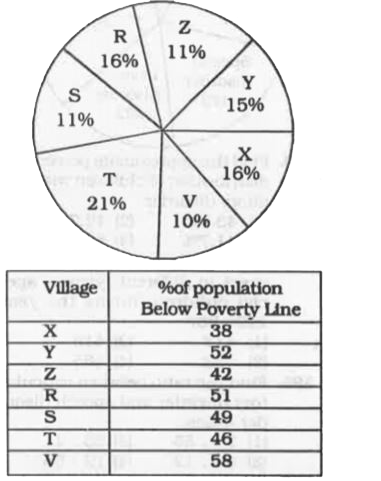
The following pie chart shows proportion of population of seven villages in 2009. Study the pie chart and answer the questions that follow :

If ratio of the below poverty line population of the village 'T' to that of the below poverty line population of village 'Z' isA11:23B13:11C23:11D11:13
96% population of a village is 7680.Find the total population of the village.
View SolutionWhat percentage of India population is below the official poverty line ?
View SolutionWhat percentage of India population is below the official poverty line ?
View SolutionWhich of the three countries has highest percentage of population above poverty line ?
View Solution96% of the population of a village is 23040. The total population of the village is…
View Solution

