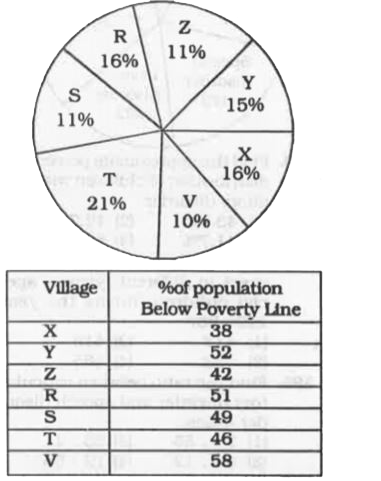
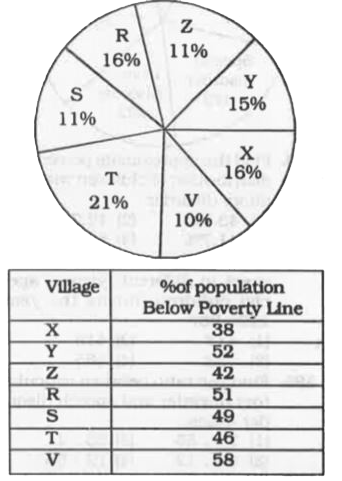
The following pie chart shows proportion of population of seven villages in 2009. Study the pie chart and answer the questions that follow :
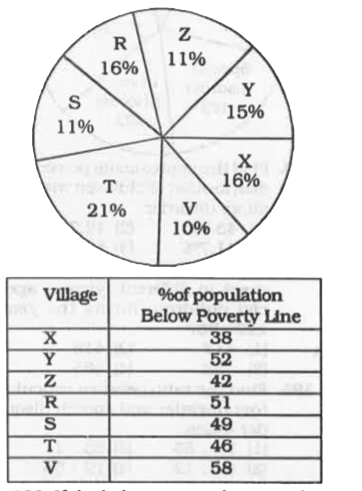
If the population of the village 'R' is 32000, then the below poverty line population of village 'Y' is
14100
15600
16500
17000
The correct Answer is:B
Step by step video, text & image solution for The following pie chart shows proportion of population of seven villages in 2009. Study the pie chart and answer the questions that follow : If the population of the village 'R' is 32000, then the below poverty line population of village 'Y' is by Maths experts to help you in doubts & scoring excellent marks in Class 14 exams.
Topper's Solved these Questions
- BOOK - KIRAN PUBLICATIONCHAPTER - STATISTICS AND DATA INTERPRETATIONEXERCISE - TYPE-VIII8videos
STATISTICS AND DATA INTERPRETATION
- BOOK - KIRAN PUBLICATIONCHAPTER - STATISTICS AND DATA INTERPRETATIONEXERCISE - TYPE-VI86videos
STATISTICS AND DATA INTERPRETATION
- BOOK - KIRAN PUBLICATIONCHAPTER - SIMPLIFICATIONEXERCISE - TEST YOURSELF25videos
SIMPLIFICATION
- BOOK - KIRAN PUBLICATIONCHAPTER - TIME AND DISTANCEEXERCISE - Type -XI74videos
TIME AND DISTANCE
Similar Questions
Knowledge Check
- Question 1 - Select One
The following pie chart shows proportion of population of seven villages in 2009. Study the pie chart and answer the questions that follow :
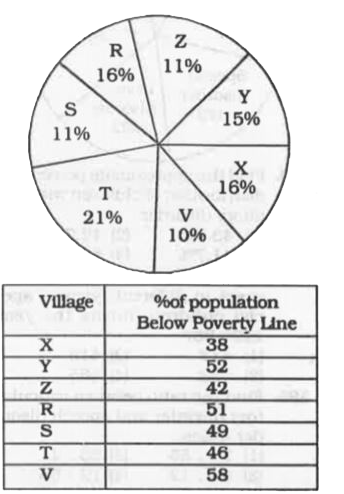
If the below poverty line population of the village 'X' is 12160, then the population of village 'S' isA18500B20500C22000D20000 - Question 2 - Select One
The following pie chart shows proportion of population of seven villages in 2009. Study the pie chart and answer the questions that follow :
If ratio of the below poverty line population of the village 'T' to that of the below poverty line population of village 'Z' isA11:23B13:11C23:11D11:13 - Question 3 - Select One
The following pie chart shows proportion of population of seven villages in 2009. Study the pie chart and answer the questions that follow :
In 2010, the population of 'Y' and 'V' increases by 10% each and the percentage of population below poverty line remains unchanged for all the villages. If in 2009, the population of villages Y was 30,000, then the below poverty line population of village 'V' in 2010 is ____A11250B12760C13140D13780
Directions: The given pie-charts compares the total population and the female population of six countries, Australia, Canada, Germany, India, USA and Philippines. The first pie chart gives the percentage distribution of the total population of the six countries, while, the second pie chart gives the percentage distribution of the female population of the six countries. Study the pie-charts and answer the questions that follow.
If the total number of females in India and USA is equal to the total population of the Philippines, then what is the ratio of the number of males in Australia to the number of females in Canada?View SolutionDirections: The given pie-charts compares the total population and the female population of six countries, Australia, Canada, Germany, India, USA and Philippines. The first pie chart gives the percentage distribution of the total population of the six countries, while, the second pie chart gives the percentage distribution of the female population of the six countries. Study the pie-charts and answer the questions that follow.
If the number of females in Germany is 116550 less than the total population of USA and Philippines, and the total population of Germany is 25900 less than 2 times the female population of Australia, then what is the female population of Germany?View SolutionDirections: The given pie-charts compares the total population and the female population of six countries, Australia, Canada, Germany, India, USA and Philippines. The first pie chart gives the percentage distribution of the total population of the six countries, while, the second pie chart gives the percentage distribution of the female population of the six countries. Study the pie-charts and answer the questions that follow.
If the average population of Australia, Canada and Germany is 155400 more than the total population of India, then the total population of USA and Philippines is how much less than the total population of India?View SolutionThe following pie-chart shows the percentage distribution of the expenditure incurred in publishing a book. Study the pie-chart and answer the questions based on it.
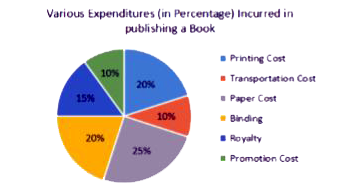
Royalty on the book is less than the paper cost by :View SolutionThe given pie chart shows the percentage distribution of 450 employees in an organisation. Study the pie chart and answer the question that follows
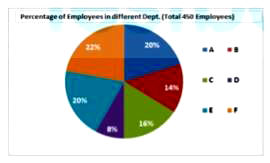
What is the central angle of the sector representing the number of employees in department A ?View Solution


