Figure given below shows the effect of light on the rate of photosynthesis .Based on the graph ,answer the following quenstions:
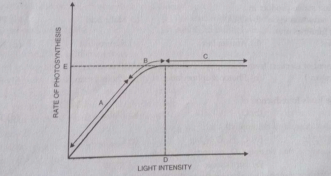
At which points (A,B or C) in the curve is light a limiting factor?Solution in Punjabi
Step by step video & image solution for Figure given below shows the effect of light on the rate of photosynthesis .Based on the graph ,answer the following quenstions:At which points (A,B or C) in the curve is light a limiting factor? by Biology experts to help you in doubts & scoring excellent marks in Class 11 exams.
Updated on:21/07/2023Topper's Solved these Questions
- PHOTOSYNTHESIS IN HIGHER PLANTSBOOK - MODERN PUBLICATIONCHAPTER - PHOTOSYNTHESIS IN HIGHER PLANTSEXERCISE - EXAMPLE
13 Videos
- NEURAL CONTROL AND COORDINATIONBOOK - MODERN PUBLICATIONCHAPTER - NEURAL CONTROL AND COORDINATIONEXERCISE - EXAMPLE
49 Videos
- PLANT GROWTH AND DEVELOPMENTBOOK - MODERN PUBLICATIONCHAPTER - PLANT GROWTH AND DEVELOPMENTEXERCISE - EXAMPLE
22 Videos
Similar Questions
By looking at a plant externally can you tell whether a plant is C3 or C4 ?Why and how?
View SolutionBriefly describe the structure of the following :
Brain
View Solutiondeterminate growth, meristem and growth rate.
View SolutionThe figure shows the effect of light on the rate of photosynthesis. Based on the graph, answer the following questions : What could be the limiting factor(s) in region A ?
View SolutionFigure given below shows the effect of light on the role of photosynthesis. Based on graph At which point/points (A,B or C) in the curve light is a limiting fac- tor?
View SolutionFigure given below shows the effect of light on the role of photosynthesis. Based on graph
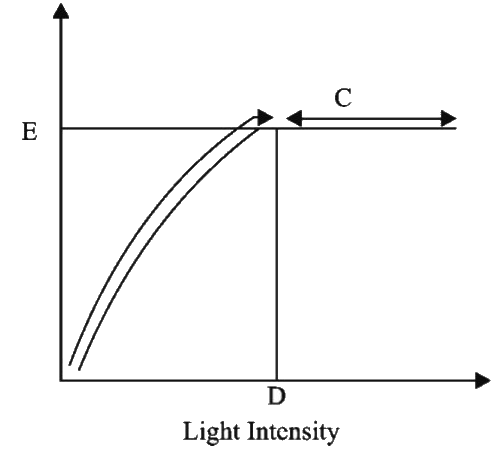
What could be the limiting factor/factors in region A?
View SolutionFigure 13.10 shows the effect of light on the rate of photosynthesis. Based on the graph, answer the following questions: (a) At which point/s (A, B or C) in the curve is light a limiting factor? (b) What could be the limiting factor/s in region A? (c) What do C and D represent on the curve?
View SolutionFigure 13.10 shows the effect of light on the rate of photosynthesis. Based on the graph, answer the following questions:
(a) At which point/s (A, B or C) in the curve is light a limiting factor?
(b) What could be the limiting factor/s in region A?
(c) What do C and D represent on the curve?
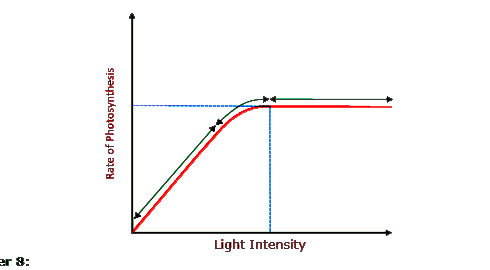
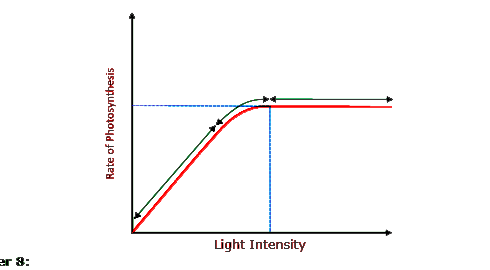
View SolutionFigure shows the effect of light on the rate of photosynthesis, Based on the graph, answer the following question : (a) At which point/s (A,B or C) in the curve is light a limiting factor ? (b) What could be the limiting factor/s is region A ? (c ) What do C and D represent on the curve ?
View SolutionFigure shows the effect of light on the rate of photosynthesis. Based on the graph, answer the following questions: What could be the limiting factors in region A?
View SolutionFigure shows the effect of light on the rate of photosynthesis. Based on the graph, answer the following questions:
What do C and D represent on the curve?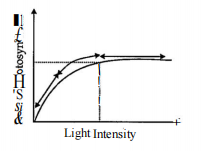
View SolutionFigure shows the effect of light on the rate of photosynthesis. Based on the graph, answer the following questions.
a. At which points (A, B or C) in the curve is light a limiting factor ?
b. What could be the limiting factor/s in region A ?
c. What do C and D represent on the curve ?
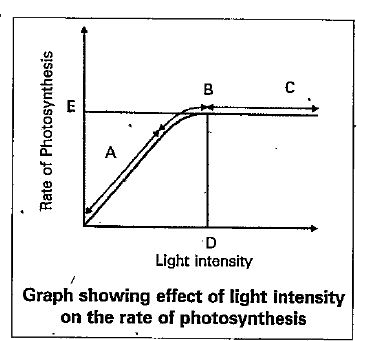
View SolutionThe given figure shows the effect of light on the rate of photosynthesís. Based on the graph, answer the fol'lowing questions: '(##VPU_HSS_BIO_XI_C13_E01_008_Q01##)' a. At which points A, B or C in the curve.is light a limiting factor? b. What could be the limiting factor/s in region A? c. What do C and D represent on the curve?
View SolutionFigure shows the effect of light on the rate of phtosynthesis. Based on the graph, answer the following question: What could be the limiting factors in region A?
View Solution
