Read the bar graph and answer the questions.
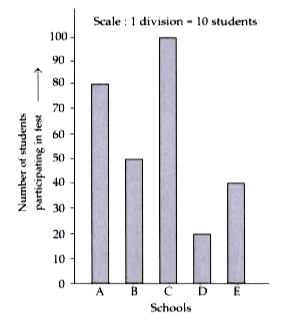
From which school 80 students participated ?
Step by step video & image solution for Read the bar graph and answer the questions. From which school 80 students participated ? by Maths experts to help you in doubts & scoring excellent marks in Class 6 exams.
Updated on:21/07/2023Topper's Solved these Questions
- DATA HANDLING BOOK - MTG IIT JEE FOUNDATIONCHAPTER - DATA HANDLING EXERCISE - NCERT Section (Exercise 9.1)
22 Videos
- DATA HANDLING BOOK - MTG IIT JEE FOUNDATIONCHAPTER - DATA HANDLING EXERCISE - NCERT Section (Exercise 9.2)
5 Videos
- DATA HANDLING BOOK - MTG IIT JEE FOUNDATIONCHAPTER - DATA HANDLING EXERCISE - Olympiad/HOTS Corner
10 Videos
- BASIC GEOMETRICAL IDEASBOOK - MTG IIT JEE FOUNDATIONCHAPTER - BASIC GEOMETRICAL IDEASEXERCISE - OLYMPIAD/HOTS CORNER
10 Videos
- DECIMALSBOOK - MTG IIT JEE FOUNDATIONCHAPTER - DECIMALSEXERCISE - OLYMPIAD/HOTS CORNER
20 Videos
Similar Questions
Read the bar graph carefully and answer the following questions.
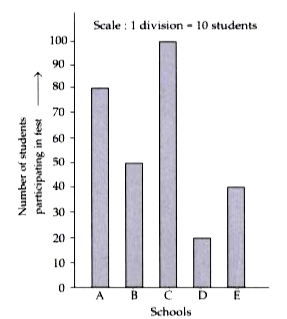 From which school maximum number of students participated ?
View SolutionThe following questions are based on the bar graph. Read the graph and answer the questions.
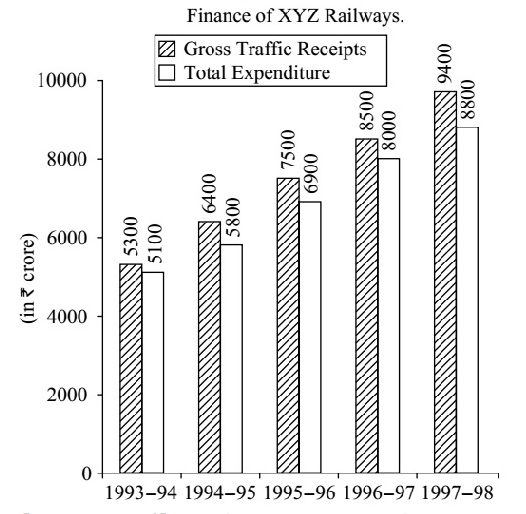
In which year was the profit as a percentage of gross traffic receipts highest?
View Solution
Knowledge Check
The given bar graph represents the number of boys and girls in five different schools. Read the graph and answer the question that follows.
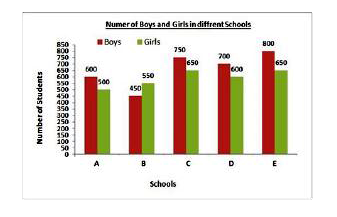
In which school is the percentage of boys more than 55%?ACBBCEDAThe given bar graph represents the number of boys and girls in five different schools. Study the graph and answer the question that follows
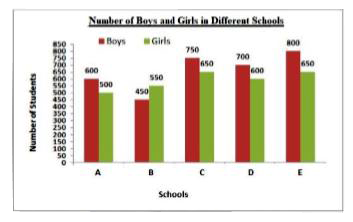
In which school is the percentage of girls the lowest ?AABBCEDCStudy the double bar graph given below and answer the questions.
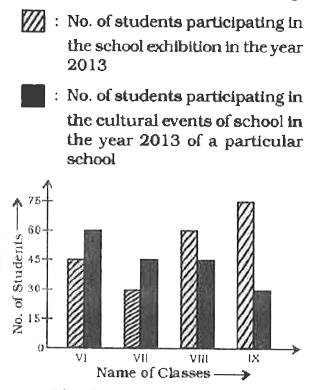
The ratio of the participants in exhibition of class IX with the total participants of class IX isA5:7B5:14C1:4D3:5
In the following questions are based on the following bar graph,Read the graphs and answer the questions.
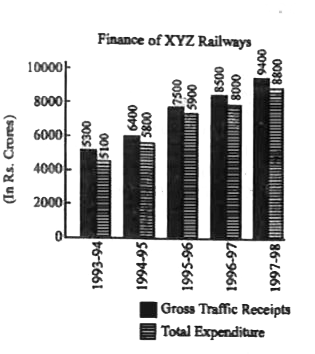
In which year was the profit as a percentage of gross traffic the highest?
View SolutionDirections for questions : These questions are based on the following data. Read the following bar graph and answer the questions.
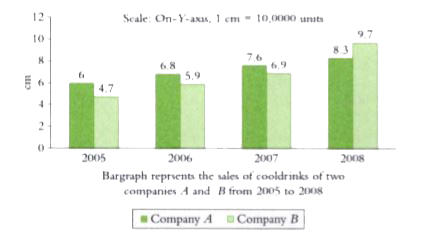
In which year is the sales of B more than the sales of A?
View SolutionThe graph shows the result of 10th class students of a school for 4 years. Study the graph and answer the questions :
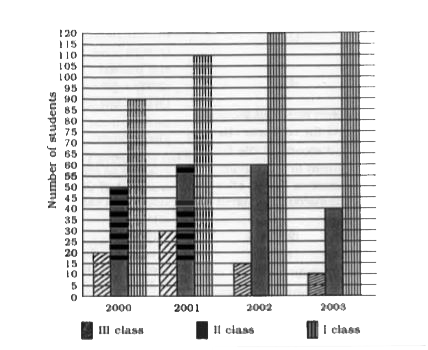
The year in which the maximum number of students appeared for the 10th class exam is
View SolutionStudy the bar graph and answer the following questions.
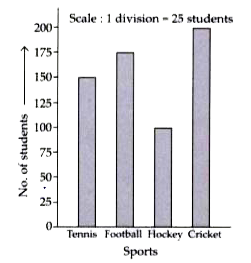
Which is the most popular sport ?
View SolutionStudy the bar graph and answer the following questions.
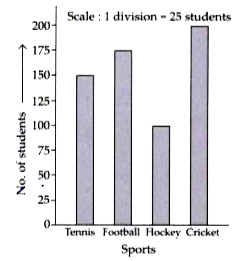
Which sport is preferred least ?
View Solution
