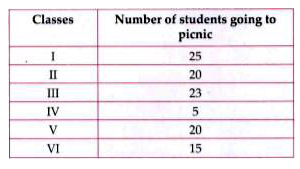
Observe the table above and calculate total number of students from class III and VI are going to the picnic.
Step by step video & image solution for Observe the table above and calculate total number of students from class III and VI are going to the picnic. by Maths experts to help you in doubts & scoring excellent marks in Class 6 exams.
Updated on:21/07/2023Topper's Solved these Questions
- DATA HANDLING BOOK - MTG IIT JEE FOUNDATIONCHAPTER - DATA HANDLING EXERCISE - NCERT Section (Exercise 9.1)
22 Videos
- DATA HANDLING BOOK - MTG IIT JEE FOUNDATIONCHAPTER - DATA HANDLING EXERCISE - NCERT Section (Exercise 9.2)
5 Videos
- DATA HANDLING BOOK - MTG IIT JEE FOUNDATIONCHAPTER - DATA HANDLING EXERCISE - Olympiad/HOTS Corner
10 Videos
- BASIC GEOMETRICAL IDEASBOOK - MTG IIT JEE FOUNDATIONCHAPTER - BASIC GEOMETRICAL IDEASEXERCISE - OLYMPIAD/HOTS CORNER
10 Videos
- DECIMALSBOOK - MTG IIT JEE FOUNDATIONCHAPTER - DECIMALSEXERCISE - OLYMPIAD/HOTS CORNER
20 Videos
Similar Questions
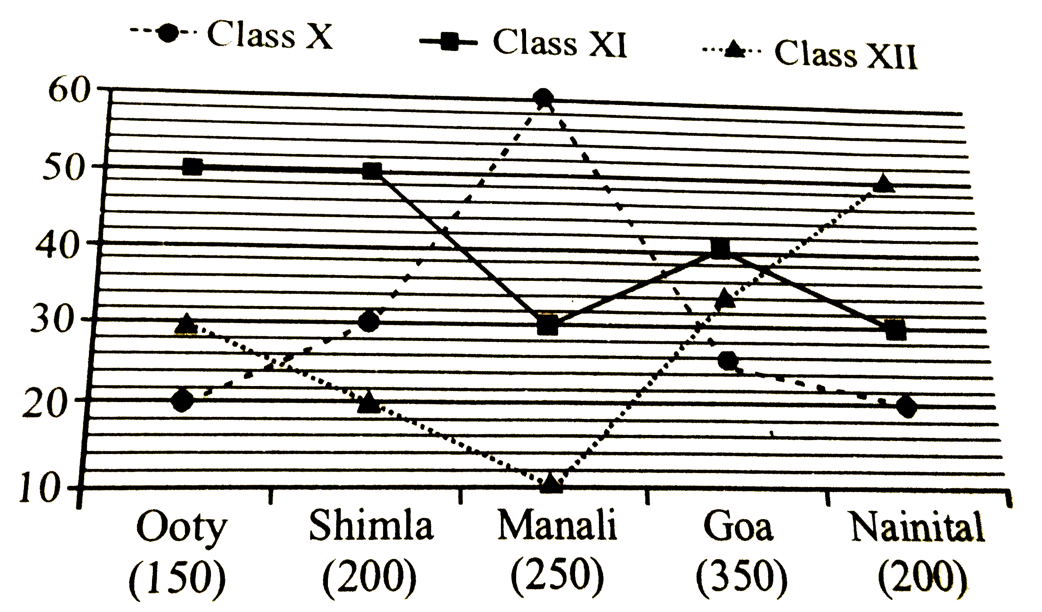
The bar graph below shows the percentage break-up of the number of student who visited various touris spots on new Year evening.

The table shows the total numbers of students om classes X,XI and XII .
ClassNo. of studentsX420XI480XII400
If the ratio of girls and boys, who went to Manali from class X, was 7:8 , then what percent of the total number of students from class X who went to a turist spot is the number of girls who went to Manali ? (approximate)
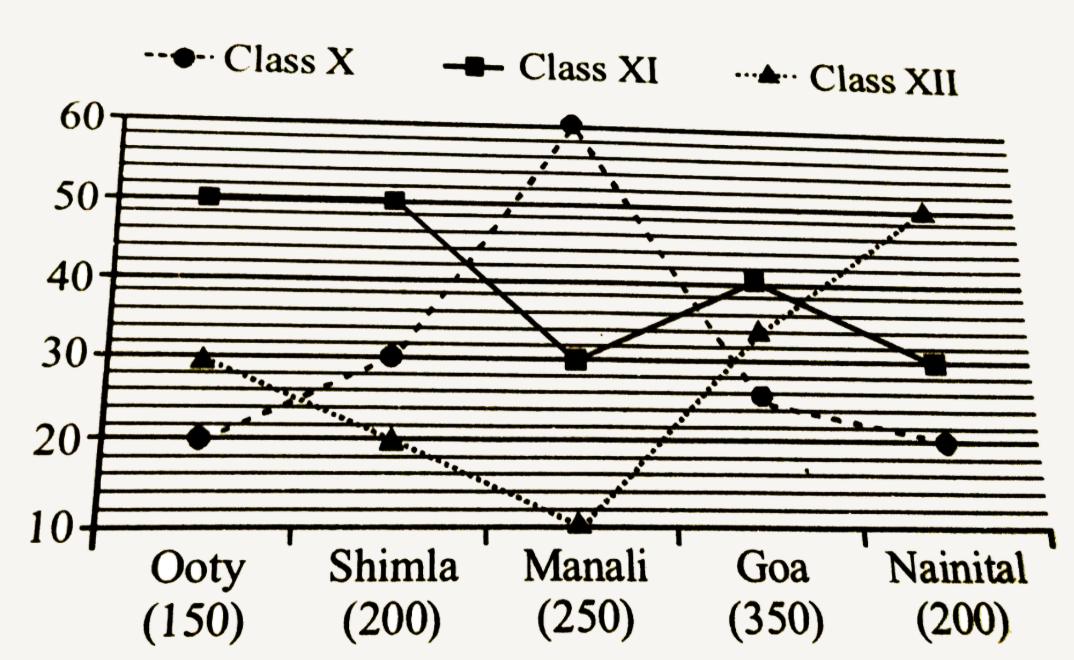
View SolutionThe bar graph below shows the percentage break-up of the number of student who visited various tourist spots on new Year evening.

The table shows the total numbers of students om classes X,XI and XII .
ClassNo. of studentsX420XI480XII400
The number of students from class XI and XII together who visited Manali is what percent of the number of students from class X who visited Shimla, Ooty and Nainital together ? (approximate)
View Solution
Knowledge Check

As per the information given in the above table approximately by what percentage is the total number of students in class A is less than those in class B?A0.09B0.1C0.11D0.13
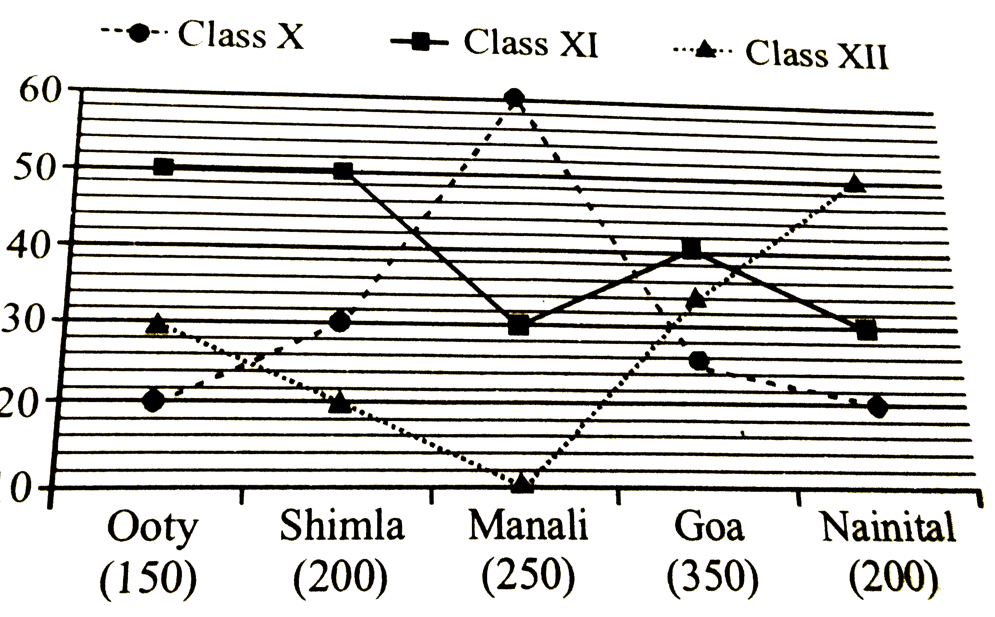
The bar graph below shows the percentage break-up of the number of student who visited various touris spots on new Year evening.

The table shows the total numbers of students om classes X,XI and XII .
ClassNo. of studentsX420XI480XII400
What is the difference between the number of students who did not got to any tourist spotfrom class XI and that from class XII ?
View SolutionDirection: There are 1250 total students in 5 different classes in a school. The number of students in class I is 50 less than the number of students in class II. The number of class IV students is 50 more than the number of students in class II. The average number of students in class III and class V is 250. The number of students in class III is 10% less than the number of students in class I.
The total number of students of class IV and the number of students of class II is
View SolutionX’s rank was 12 from the top. If the total number of students in the class was 16, then X’s rank from the bottom of the class is:
View SolutionDirection: There are 1250 total students in 5 different classes in a school. The number of students in class I is 50 less than the number of students in class II. The number of class IV students is 50 more than the number of students in class II. The average number of students in class III and class V is 250. The number of students in class III is 10% less than the number of students in class I.
The ratio of the total number of students of class V to the total number of students of class III is
View SolutionDirection: There are 1250 total students in 5 different classes in a school. The number of students in class I is 50 less than the number of students in class II. The number of class IV students is 50 more than the number of students in class II. The average number of students in class III and class V is 250. The number of students in class III is 10% less than the number of students in class I.
The number of students of class V is what percent of the total number of students?
View SolutionDirection: There are 1250 total students in 5 different classes in a school. The number of students in class I is 50 less than the number of students in class II. The number of class IV students is 50 more than the number of students in class II. The average number of students in class III and class V is 250. The number of students in class III is 10% less than the number of students in class I.
The average number of students of class II and class III is
View SolutionDirection: There are 1250 total students in 5 different classes in a school. The number of students in class I is 50 less than the number of students in class II. The number of class IV students is 50 more than the number of students in class II. The average number of students in class III and class V is 250. The number of students in class III is 10% less than the number of students in class I.
The number of students of class I is -
View Solution