Observe this bar graph which is showing the sale of shirts in a ready made shop from Monday to Saturday.
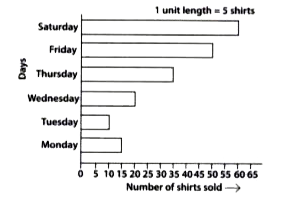
Now answer the following questions :
What is the scale chosen on the horizontal line representing number of shirts ?
Step by step video & image solution for Observe this bar graph which is showing the sale of shirts in a ready made shop from Monday to Saturday. Now answer the following questions : What is the scale chosen on the horizontal line representing number of shirts ? by Maths experts to help you in doubts & scoring excellent marks in Class 6 exams.
Topper's Solved these Questions
- BOOK - MTG IIT JEE FOUNDATIONCHAPTER - DATA HANDLING EXERCISE - NCERT Section (Exercise 9.4)4videos
DATA HANDLING
- BOOK - MTG IIT JEE FOUNDATIONCHAPTER - DATA HANDLING EXERCISE - Exercise (Multiple Choice Questions) Level -135videos
DATA HANDLING
- BOOK - MTG IIT JEE FOUNDATIONCHAPTER - DATA HANDLING EXERCISE - NCERT Section (Exercise 9.2)5videos
DATA HANDLING
- BOOK - MTG IIT JEE FOUNDATIONCHAPTER - BASIC GEOMETRICAL IDEASEXERCISE - OLYMPIAD/HOTS CORNER10videos
BASIC GEOMETRICAL IDEAS
- BOOK - MTG IIT JEE FOUNDATIONCHAPTER - DECIMALSEXERCISE - OLYMPIAD/HOTS CORNER20videos
DECIMALS
Similar Questions
Observe this bar graph which is showing the sale of shirts in a ready made shop from Monday to Saturday.
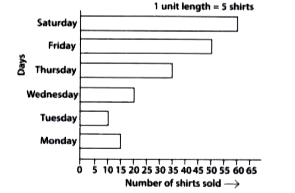
Now answer the following questions :
How many shirts were sold on Thursday ?View SolutionObserve this bar graph which is showing the sale of shirts in a ready made shop from Monday to Saturday.
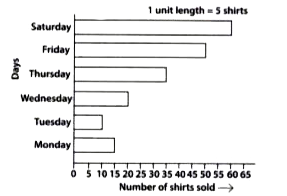
Now answer the following questions :
What information does the above bar graph give ?View Solution
Knowledge Check
- Question 1 - Select One
The following bar graph shows the number of students in a particular class of school. Then, answer the following questions.
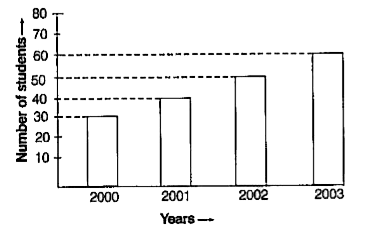
What is the number of students in the year 2003?A10B25C45D60 - Question 2 - Select One
The following bar graph shows the number of students in a particular class of school. Then, answer the following questions.
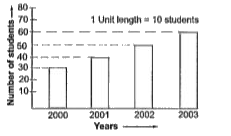
(i) What is the nuber of students in the year 2003 ?A70B60C50D40 - Question 3 - Select One
The bar graph shows the annual sales of the different departments of a company. Study the diagram and answer the following questions.
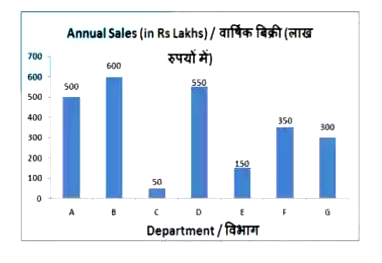
Which department has the second highest annual sales?ADBACBDF
Observe this bar graph which is showing the sale of shirts in a ready made shop from Monday to Saturday.
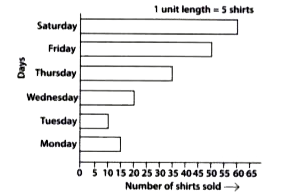
Now answer the following questions :
On which day were the minimum number of shirts sold ?View SolutionObserve this bar graph which is showing the sale of shirts in a ready made shop from Monday to Saturday.
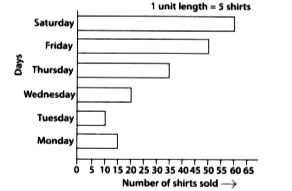
Now answer the following questions :
On which day were the maximum number of shirts sold ? How many shirts were sold on that day ?View SolutionThe following bar graph shows the number of students in a particular class of school. Then, answer the following questions.
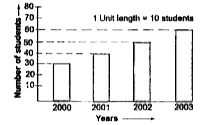
What is the number of students in the year 2003?View SolutionObserve the bar graph and answer the following questions.
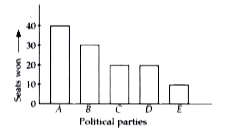
What is the total number of seats won by party A and party B?View SolutionThe bar graph shows the annual sales of the different departments of a company. Study the diagram and answer the following questions.
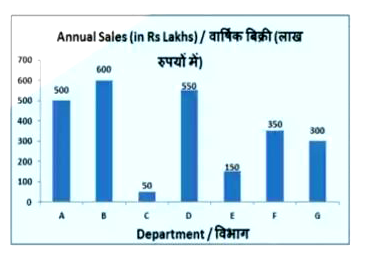
What is the ratio of the annual sales of department B to that of department F ?View Solution

