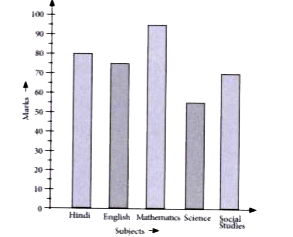
Observe this bar graph which shows the marks obtained by Aziz in half-yearly examination in different subjects.
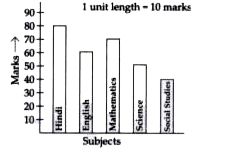
Answer the given questions.
State the name of the subjects and marks obtained in each of them.
Step by step video & image solution for Observe this bar graph which shows the marks obtained by Aziz in half-yearly examination in different subjects. Answer the given questions. State the name of the subjects and marks obtained in each of them. by Maths experts to help you in doubts & scoring excellent marks in Class 6 exams.
Updated on:21/07/2023Topper's Solved these Questions
- DATA HANDLING Book:MTG IIT JEE FOUNDATIONChapter:DATA HANDLING Exercise:NCERT Section (Exercise 9.4)
Explore 4 Videos
- DATA HANDLING Book:MTG IIT JEE FOUNDATIONChapter:DATA HANDLING Exercise:Exercise (Multiple Choice Questions) Level -1
Explore 35 Videos
- DATA HANDLING Book:MTG IIT JEE FOUNDATIONChapter:DATA HANDLING Exercise:NCERT Section (Exercise 9.2)
Explore 5 Videos
- BASIC GEOMETRICAL IDEASBook:MTG IIT JEE FOUNDATIONChapter:BASIC GEOMETRICAL IDEASExercise:OLYMPIAD/HOTS CORNER
Explore 10 Videos
- DECIMALSBook:MTG IIT JEE FOUNDATIONChapter:DECIMALSExercise:OLYMPIAD/HOTS CORNER
Explore 20 Videos
Similar Questions
Observe this bar graph which shows the marks obtained by Aziz in half-yearly examination in different subjects.
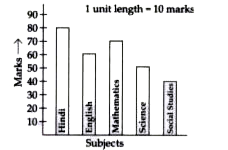
Answer the given questions.
What information does the bar graph give ?
View SolutionObserve this bar graph which shows the marks obtained by Aziz in half-yearly examination in different subjects.
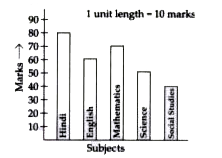
Answer the given questions.
Name the subject in which Aziz scored maximum marks.
View Solution
Knowledge Check
Study the following bar graph which shows the marks obtained by Shyam in different subjects of 100 marks each in an examination.
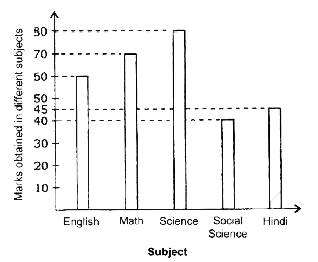
What is the percentage marks of Shyam in Science?A50B80C70D60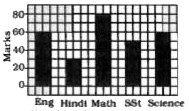
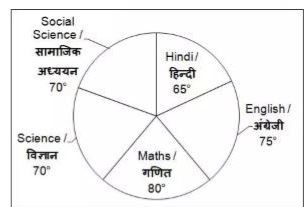
The above bar graph show the marks obtained by a students in an examination. What is the average marks obtained by the student ?A55B56C57D58The given pie chart shows the marks obtained in an examination by a student (in degree). Observe the pie chart and answer the question that follows.
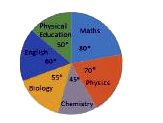
If the total marks are 720, then the marks obtained in Mathematics are:A140B160C120D80
Observe this bar graph which shows the marks obtained by Aziz in half-yearly examination in different subjects.
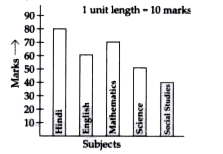
Answer the given questions.
Name the subject in which he has scored minimum marks.
View SolutionThe bar graph shows the marks obtained by Kashish in half-yearly examination in various subjects.
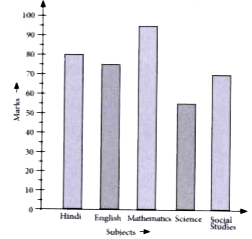
Draw a pictograph for the above data and then answer the following questions.
Name the subjects in which Kashish scored minimum and maximum marks.
View SolutionThe bar graph shows the marks obtained by Kashish in half-yearly examination in various subjects.
Draw a pictograph for the above data and then answer the following questions.
Find the total marks scored by Kashish.
View SolutionStudy the given histogram that shows the marks obtained by students in an examination and answer the question that follows .
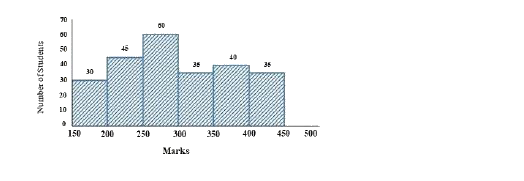
The number of students who obtained less than 250 marks is :
View SolutionThe given pie chart shows the marks obtained in degrees) by a student in different subjects. The total marks obtained by the student in the examination is 432.
In how many subjects marks obtained are more than the average marks per subject?
View Solution