Observe this bar graph which is showing the sale of shirts in a ready made shop from Monday to Saturday.
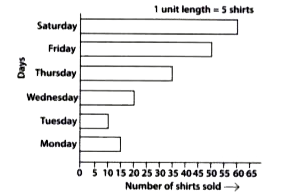
Now answer the following questions :
On which day were the minimum number of shirts sold ?
The correct Answer is:On Tuesday
Step by step video, text & image solution for Observe this bar graph which is showing the sale of shirts in a ready made shop from Monday to Saturday. Now answer the following questions : On which day were the minimum number of shirts sold ? by Maths experts to help you in doubts & scoring excellent marks in Class 6 exams.
Topper's Solved these Questions
- BOOK - MTG IIT JEE FOUNDATIONCHAPTER - DATA HANDLING EXERCISE - NCERT Section (Exercise 9.4)4videos
DATA HANDLING
- BOOK - MTG IIT JEE FOUNDATIONCHAPTER - DATA HANDLING EXERCISE - Exercise (Multiple Choice Questions) Level -135videos
DATA HANDLING
- BOOK - MTG IIT JEE FOUNDATIONCHAPTER - DATA HANDLING EXERCISE - NCERT Section (Exercise 9.2)5videos
DATA HANDLING
- BOOK - MTG IIT JEE FOUNDATIONCHAPTER - BASIC GEOMETRICAL IDEASEXERCISE - OLYMPIAD/HOTS CORNER10videos
BASIC GEOMETRICAL IDEAS
- BOOK - MTG IIT JEE FOUNDATIONCHAPTER - DECIMALSEXERCISE - OLYMPIAD/HOTS CORNER20videos
DECIMALS
Similar Questions
Observe this bar graph which is showing the sale of shirts in a ready made shop from Monday to Saturday.
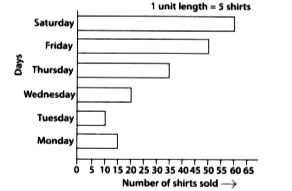
Now answer the following questions :
On which day were the maximum number of shirts sold ? How many shirts were sold on that day ?View SolutionObserve this bar graph which is showing the sale of shirts in a ready made shop from Monday to Saturday.
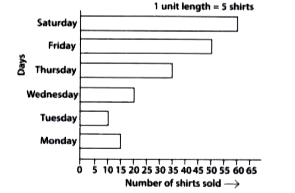
Now answer the following questions :
How many shirts were sold on Thursday ?View Solution
Knowledge Check
- Question 1 - Select One
Study the graph and answer the questions.
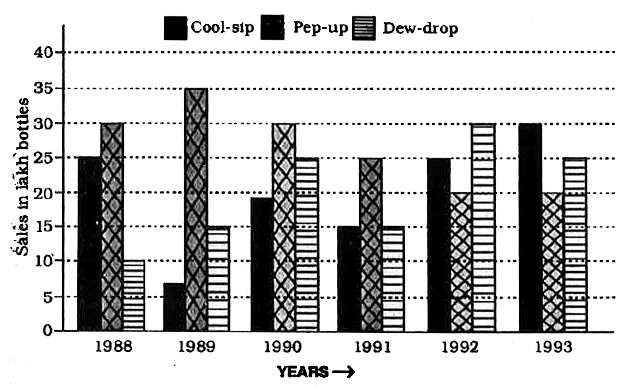
In which year the sale of cool-sip is minimum ?A1990B1992C1993DNone of the above
Observe this bar graph which is showing the sale of shirts in a ready made shop from Monday to Saturday.
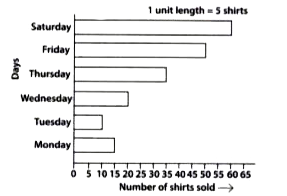
Now answer the following questions :
What information does the above bar graph give ?View SolutionObserve this bar graph which is showing the sale of shirts in a ready made shop from Monday to Saturday.
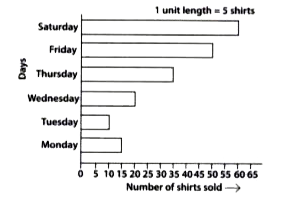
Now answer the following questions :
What is the scale chosen on the horizontal line representing number of shirts ?View SolutionThe sale of electric bulbs on different days of week is shown below :
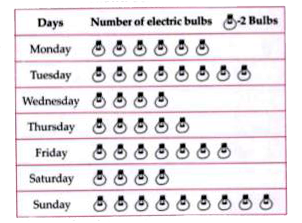
Observe the pictograph and answer the following questions :
On which day were the maximum number of bulbs sold ?View SolutionGiven bar graph shows the number of books of difference subjects kept in a library. Study it and answer the following questions :
Which subject has minimum number of books in the library ?View SolutionLook at the bar graph and answer the following questions.
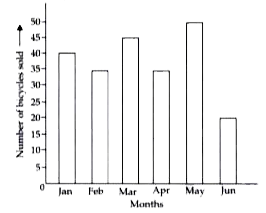
In which month 40 bicycles were sold?View SolutionStudy the graph and answer the questions.
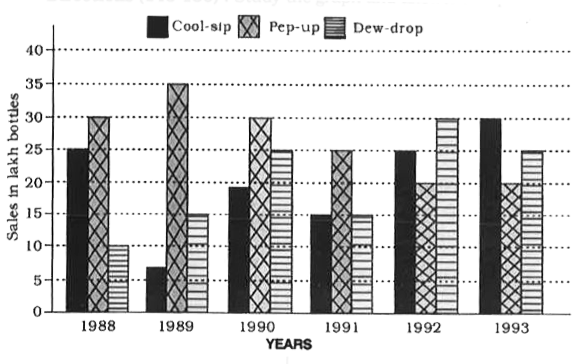
In which year the sale of coolsip is minimum?View SolutionThe sales of rings on different days of the week is shown below. Based on the information given in pictograph, answer the following questions.
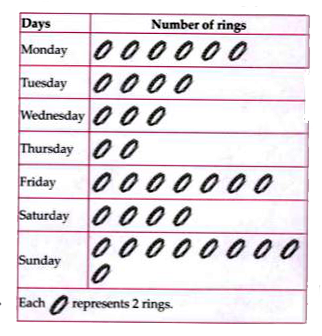
On which day, the maximum number of rings were sold ?View Solution

