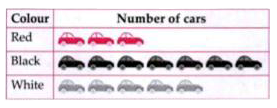
The following pictograph shows the sale of cars of different colours in a showroom.
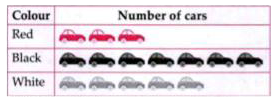

The ratio of white cars to black cars sold is
4:5
5:7
3:5
3:7
The correct Answer is:B
Step by step video & image solution for The following pictograph shows the sale of cars of different colours in a showroom. The ratio of white cars to black cars sold is by Maths experts to help you in doubts & scoring excellent marks in Class 6 exams.
Updated on:21/07/2023Topper's Solved these Questions
- DATA HANDLING BOOK - MTG IIT JEE FOUNDATIONCHAPTER - DATA HANDLING EXERCISE - Exercise (Match the following)
2 Videos
- DATA HANDLING BOOK - MTG IIT JEE FOUNDATIONCHAPTER - DATA HANDLING EXERCISE - Exercise (Assertion & Reason Type )
5 Videos
- DATA HANDLING BOOK - MTG IIT JEE FOUNDATIONCHAPTER - DATA HANDLING EXERCISE - Exercise (Multiple Choice Questions) Level -1
35 Videos
- BASIC GEOMETRICAL IDEASBOOK - MTG IIT JEE FOUNDATIONCHAPTER - BASIC GEOMETRICAL IDEASEXERCISE - OLYMPIAD/HOTS CORNER
10 Videos
- DECIMALSBOOK - MTG IIT JEE FOUNDATIONCHAPTER - DECIMALSEXERCISE - OLYMPIAD/HOTS CORNER
20 Videos
Similar Questions
Knowledge Check
Improve the given sentence by selecting aprropriate word/words. The thieves ran away in a black car.
AfledBescaped withCjumped awayDNo ImprovementThe Table shows the number of cars sold by three showrooms over a period of six years.
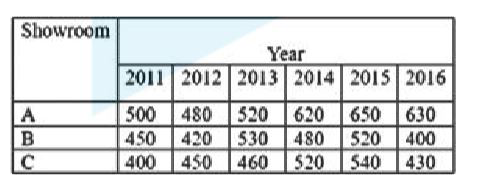
What is the ratio of the total cars sold by showroom B during the years 2014 and 2016 and the total cars sold by showroom C during 2015 and 2016?A88:97B85:97C88:95D86:97Loss on sale of an old car is debited to
AProfit and Loss A/cBCar A/cCDpreciation A/cDNone of these
The following graph shows the sales of cars (in thousands) in four cities in 4 years. Study the graph and answer the question.
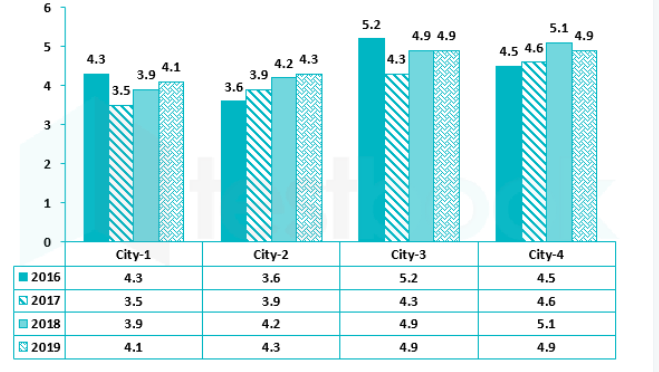
Which city has the highest sales?
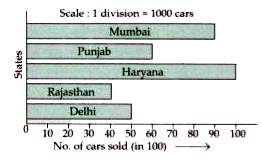
View SolutionThe given bar graph represents the sale of cars in five different states in a month.
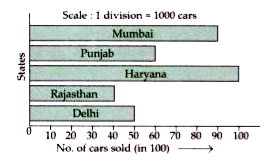 What is the difference between the numbre of cars sold in Mumbai and Punjab ?
View SolutionThe given bar graph represents the sale of cars in five different states in a month.
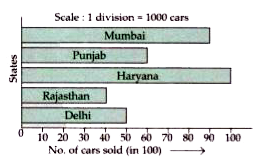
Which state sold maximum number of cars ?
View SolutionThe given double bar graph shows the sale of mobile phone and cars from 2005 to 2008
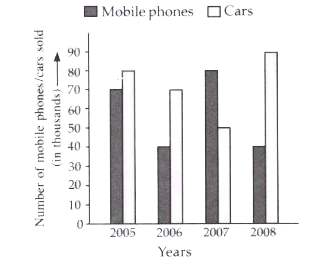
(i) Find the ratio of the tatal number of mobile phones sold in 2006 and 2008 to the total number of cars sold in 2005 and 2007
(ii) What is the average number of cars sold from 2005 to 2008
View SolutionLoss on sale of an old car is debited to
View Solution

