The given pictograph represents the number of students in 5 sections of class VI.
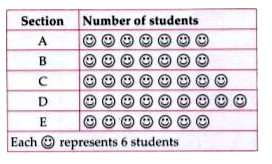
Study the given pictograph and answer the following questions.
Find the difference between the number of students in section E and the total number of students in section C and D together.
The correct Answer is:60
Step by step video & image solution for The given pictograph represents the number of students in 5 sections of class VI. Study the given pictograph and answer the following questions. Find the difference between the number of students in section E and the total number of students in section C and D together. by Maths experts to help you in doubts & scoring excellent marks in Class 6 exams.
Updated on:21/07/2023Topper's Solved these Questions
- DATA HANDLING BOOK - MTG IIT JEE FOUNDATIONCHAPTER - DATA HANDLING EXERCISE - NCERT Section (Exercise 9.1)
22 Videos
- DATA HANDLING BOOK - MTG IIT JEE FOUNDATIONCHAPTER - DATA HANDLING EXERCISE - NCERT Section (Exercise 9.2)
5 Videos
- DATA HANDLING BOOK - MTG IIT JEE FOUNDATIONCHAPTER - DATA HANDLING EXERCISE - Olympiad/HOTS Corner
10 Videos
- BASIC GEOMETRICAL IDEASBOOK - MTG IIT JEE FOUNDATIONCHAPTER - BASIC GEOMETRICAL IDEASEXERCISE - OLYMPIAD/HOTS CORNER
10 Videos
- DECIMALSBOOK - MTG IIT JEE FOUNDATIONCHAPTER - DECIMALSEXERCISE - OLYMPIAD/HOTS CORNER
20 Videos
Similar Questions
The given pictograph represents the number of students in 5 sections of class VI.
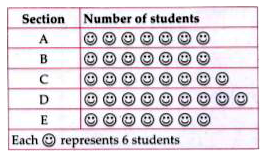
Study the given pictograph and answer the following questions.
Find the total number of students in 5 sections of Class VI.
View SolutionThe given pictograph represents the number of students in 5 sections of class VI.
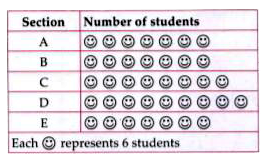
Study the given pictograph and answer the following questions.
Which section has 48 students ?
View Solution
Knowledge Check
Study the following graph carefully and answer the questions that follow
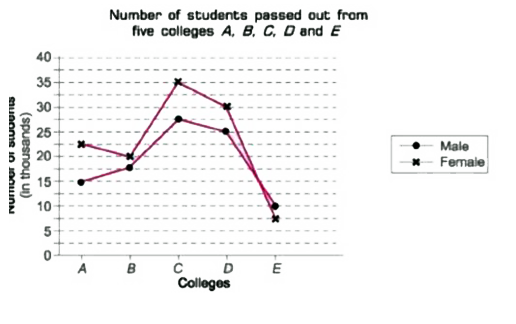
What is the difference between the total number of students passing out from collegee A and the total number o students passing out from college El.A20500BNone of theseC10500D10000
The given pictograph represents the number of students in 5 sections of class VI.
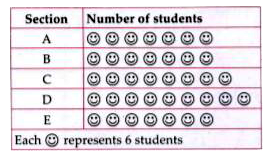
Study the given pictograph and answer the following questions.
How may students are there in section E ?
View SolutionThe given pictograph represents the number of students in 5 sections of class VI.
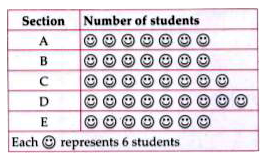
Study the given pictograph and answer the following questions.
How many less students are there in section E than section D ?
View SolutionThe pie chart given below shows the number of students in 6 different sections. The total number of students is 1800.
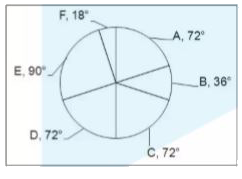
What is the difference between the number of students in section F to the number of students in section C?
View SolutionDraw a pictograph for representing the number of students in each class based on the given data.

View SolutionStudy the given pie chart and answer the question that follows
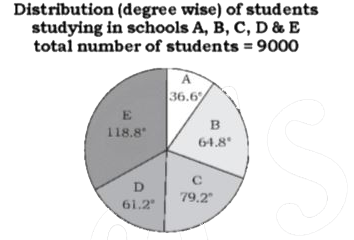
The total number of students in schools D and E is what percentage more than the number of students in schools B and C?
View SolutionStudy the given pie chart and answer the question that follows
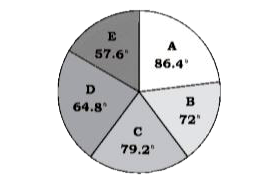
If the total number of students in schools D and E exceeds the number of students in school by x, then x lies between
View SolutionThe pie chart given below shows the number of students in 6 different sections. The total number of students is 1800.
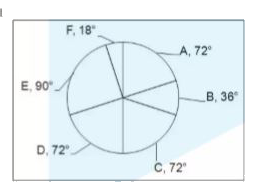
What is the total number of students in section E, C and F?
View Solution
