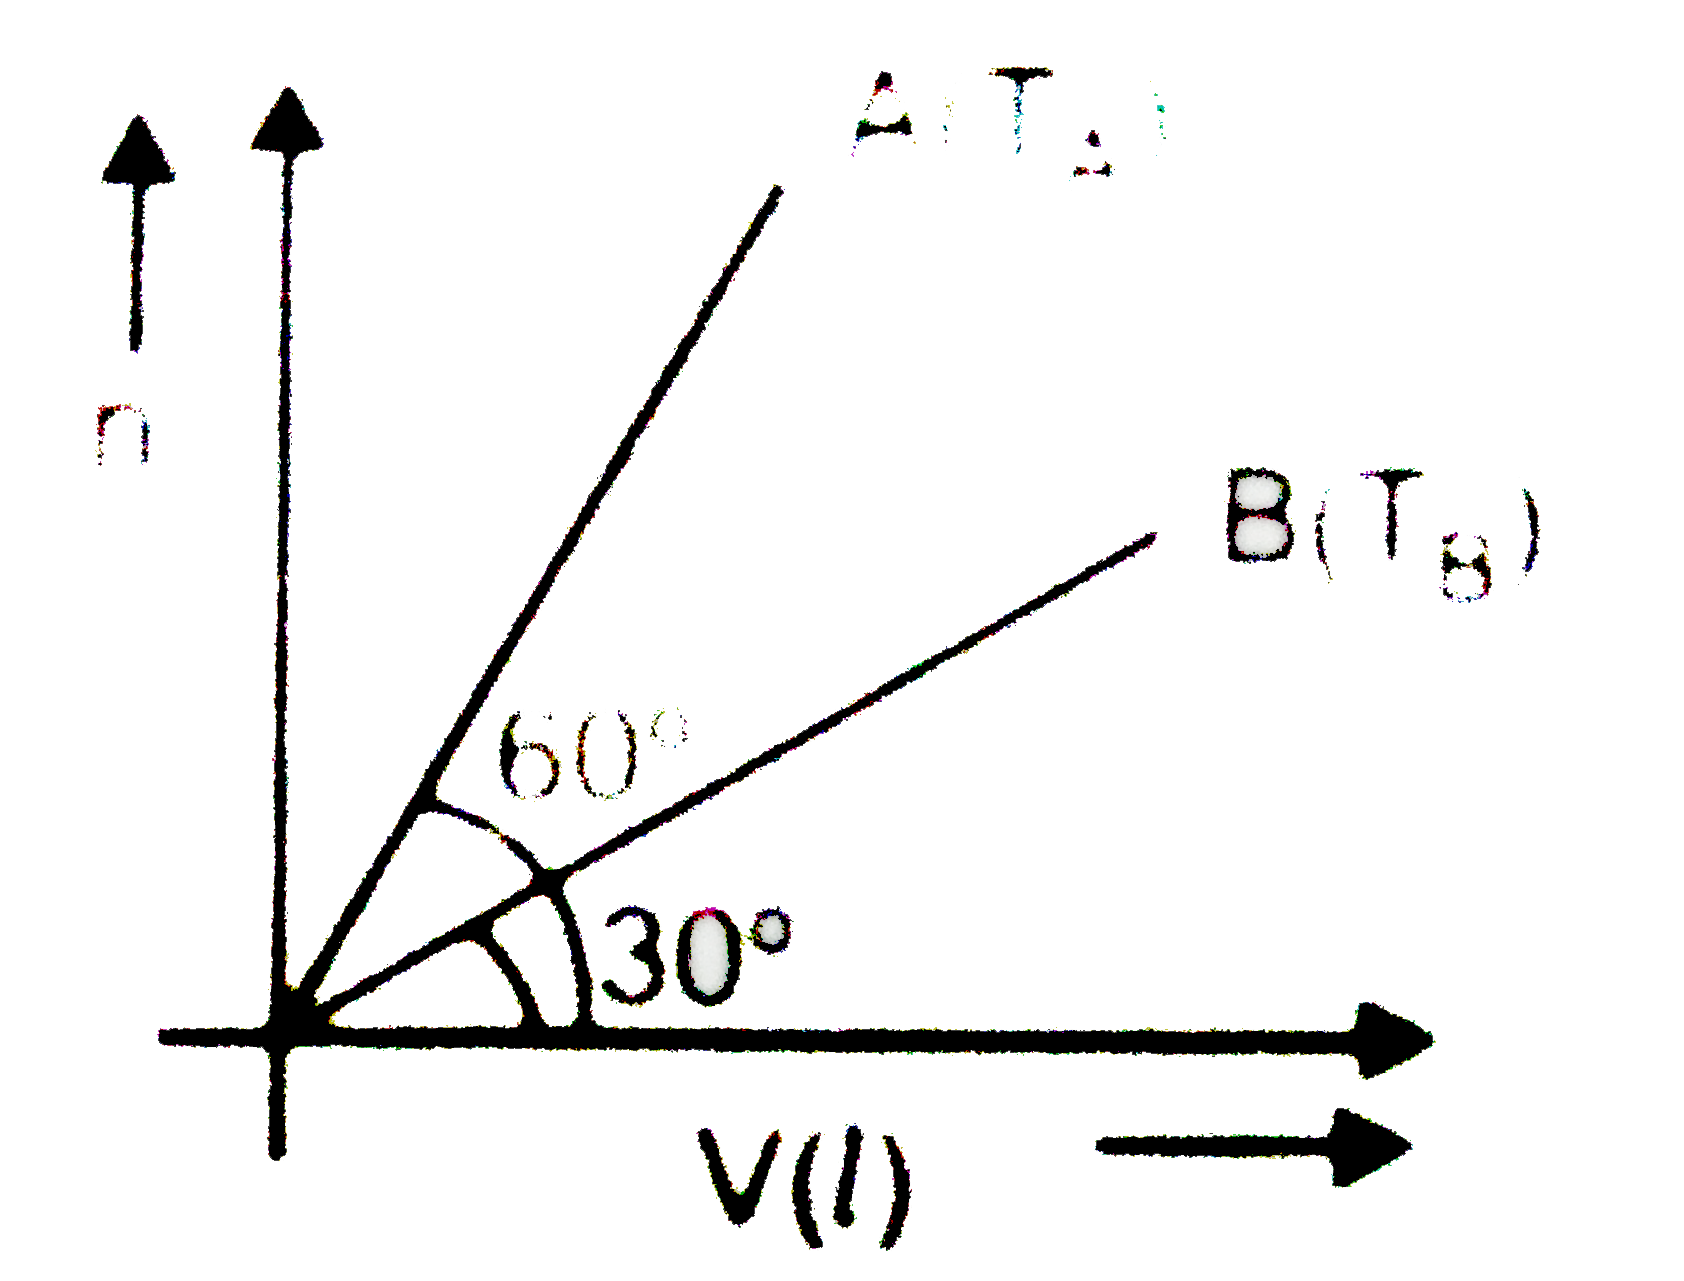
For two samples A and B of ideal gas following curve is plotted between n vs V (volume of container 16.42 atm pressure as follows, then temperature of A and B respectively are:
 Solution in Malayalam
200√3,200√3K
200√3∘C,(200√3)∘C
200√3K,200√3K
200K,√3200K
The correct Answer is:A
n=(PRT)V, slope of line = PRT=tanθ⇒T=PRtanθ=16.420.0821tanθ
For B , T = 200√3K For A,T=200√3 K
Topper's Solved these Questions
- BOOK - BRILLIANT PUBLICATIONCHAPTER - STATES OF MATTER EXERCISE - LEVEL III (Single Correct Answer Type)10videos
STATES OF MATTER
- BOOK - BRILLIANT PUBLICATIONCHAPTER - STATES OF MATTER EXERCISE - LEVEL III (Multiple Correct Answer type )14videos
STATES OF MATTER
- BOOK - BRILLIANT PUBLICATIONCHAPTER - STATES OF MATTER EXERCISE - LEVEL I50videos
STATES OF MATTER
- BOOK - BRILLIANT PUBLICATIONCHAPTER - SOME BASIC CONCEPTS OF CHEMISTRYEXERCISE - LEVEL-I55videos
SOME BASIC CONCEPTS OF CHEMISTRY
- BOOK - BRILLIANT PUBLICATIONCHAPTER - STRUCTURE OF ATOMSEXERCISE - LEVEL - III (Linked Comprehension Type)8videos
STRUCTURE OF ATOMS
Similar Questions
What percentage of a sample of nitrogen must be allowed to escape if its temperature, pressure and volume are changed from 220∘C, 3.0 atm and 1.65 L to 110∘C, 0.7 atm and 1.0 L respectively? : 0.1813, 0.34, 0.62, 0.8187
04:14View SolutionWhich of the following changes decrease the vapour pressure of water kept in a sealed vessel? Decreasing the quantity of water Adding salt to water Decreasing the volume of the vessel to one-half Decreasing the temperature of water
View SolutionAccording to kinetic theory of gases for a diatomic molecule
02:36View SolutionWhich of the following is a characteristic of both mixtures and compounds?
01:49View SolutionThe hydrogen-like species Ļi2+ is in a spherically symmetric state S1 with one radial node. Upon absorbing light the ion undergoes transition to a state S2 The state S2 has one radial node and its energy is equal to the ground state energy of the hydrogen atom.
The state S1 is: 1s, 2s, 2p, 3s02:27View SolutionWhich of the following volume-temperature (V-I) plots represents the behaviour of 1 "mole" of an ideal gas at the atmospheric pressure?
01:59View SolutionA graph is plotted between p (atm) vs t^(@)C for 10 mol of an ideal gas as follows: Then slope of curve and volume of container (L) respectively, are:
View SolutionFor two samples of ideal gases A and B curves are plotted n vs V (volume of container ) at 16.42 atm pressure. Then temperature of A and B respectively are:
 07:18View Solution
STATEMENT-1 : Plot of P vs 1/V (volume) is a straight line for an ideal gas. STATEMENT-2 : Pressure is directly proportional to volume for an ideal gas.
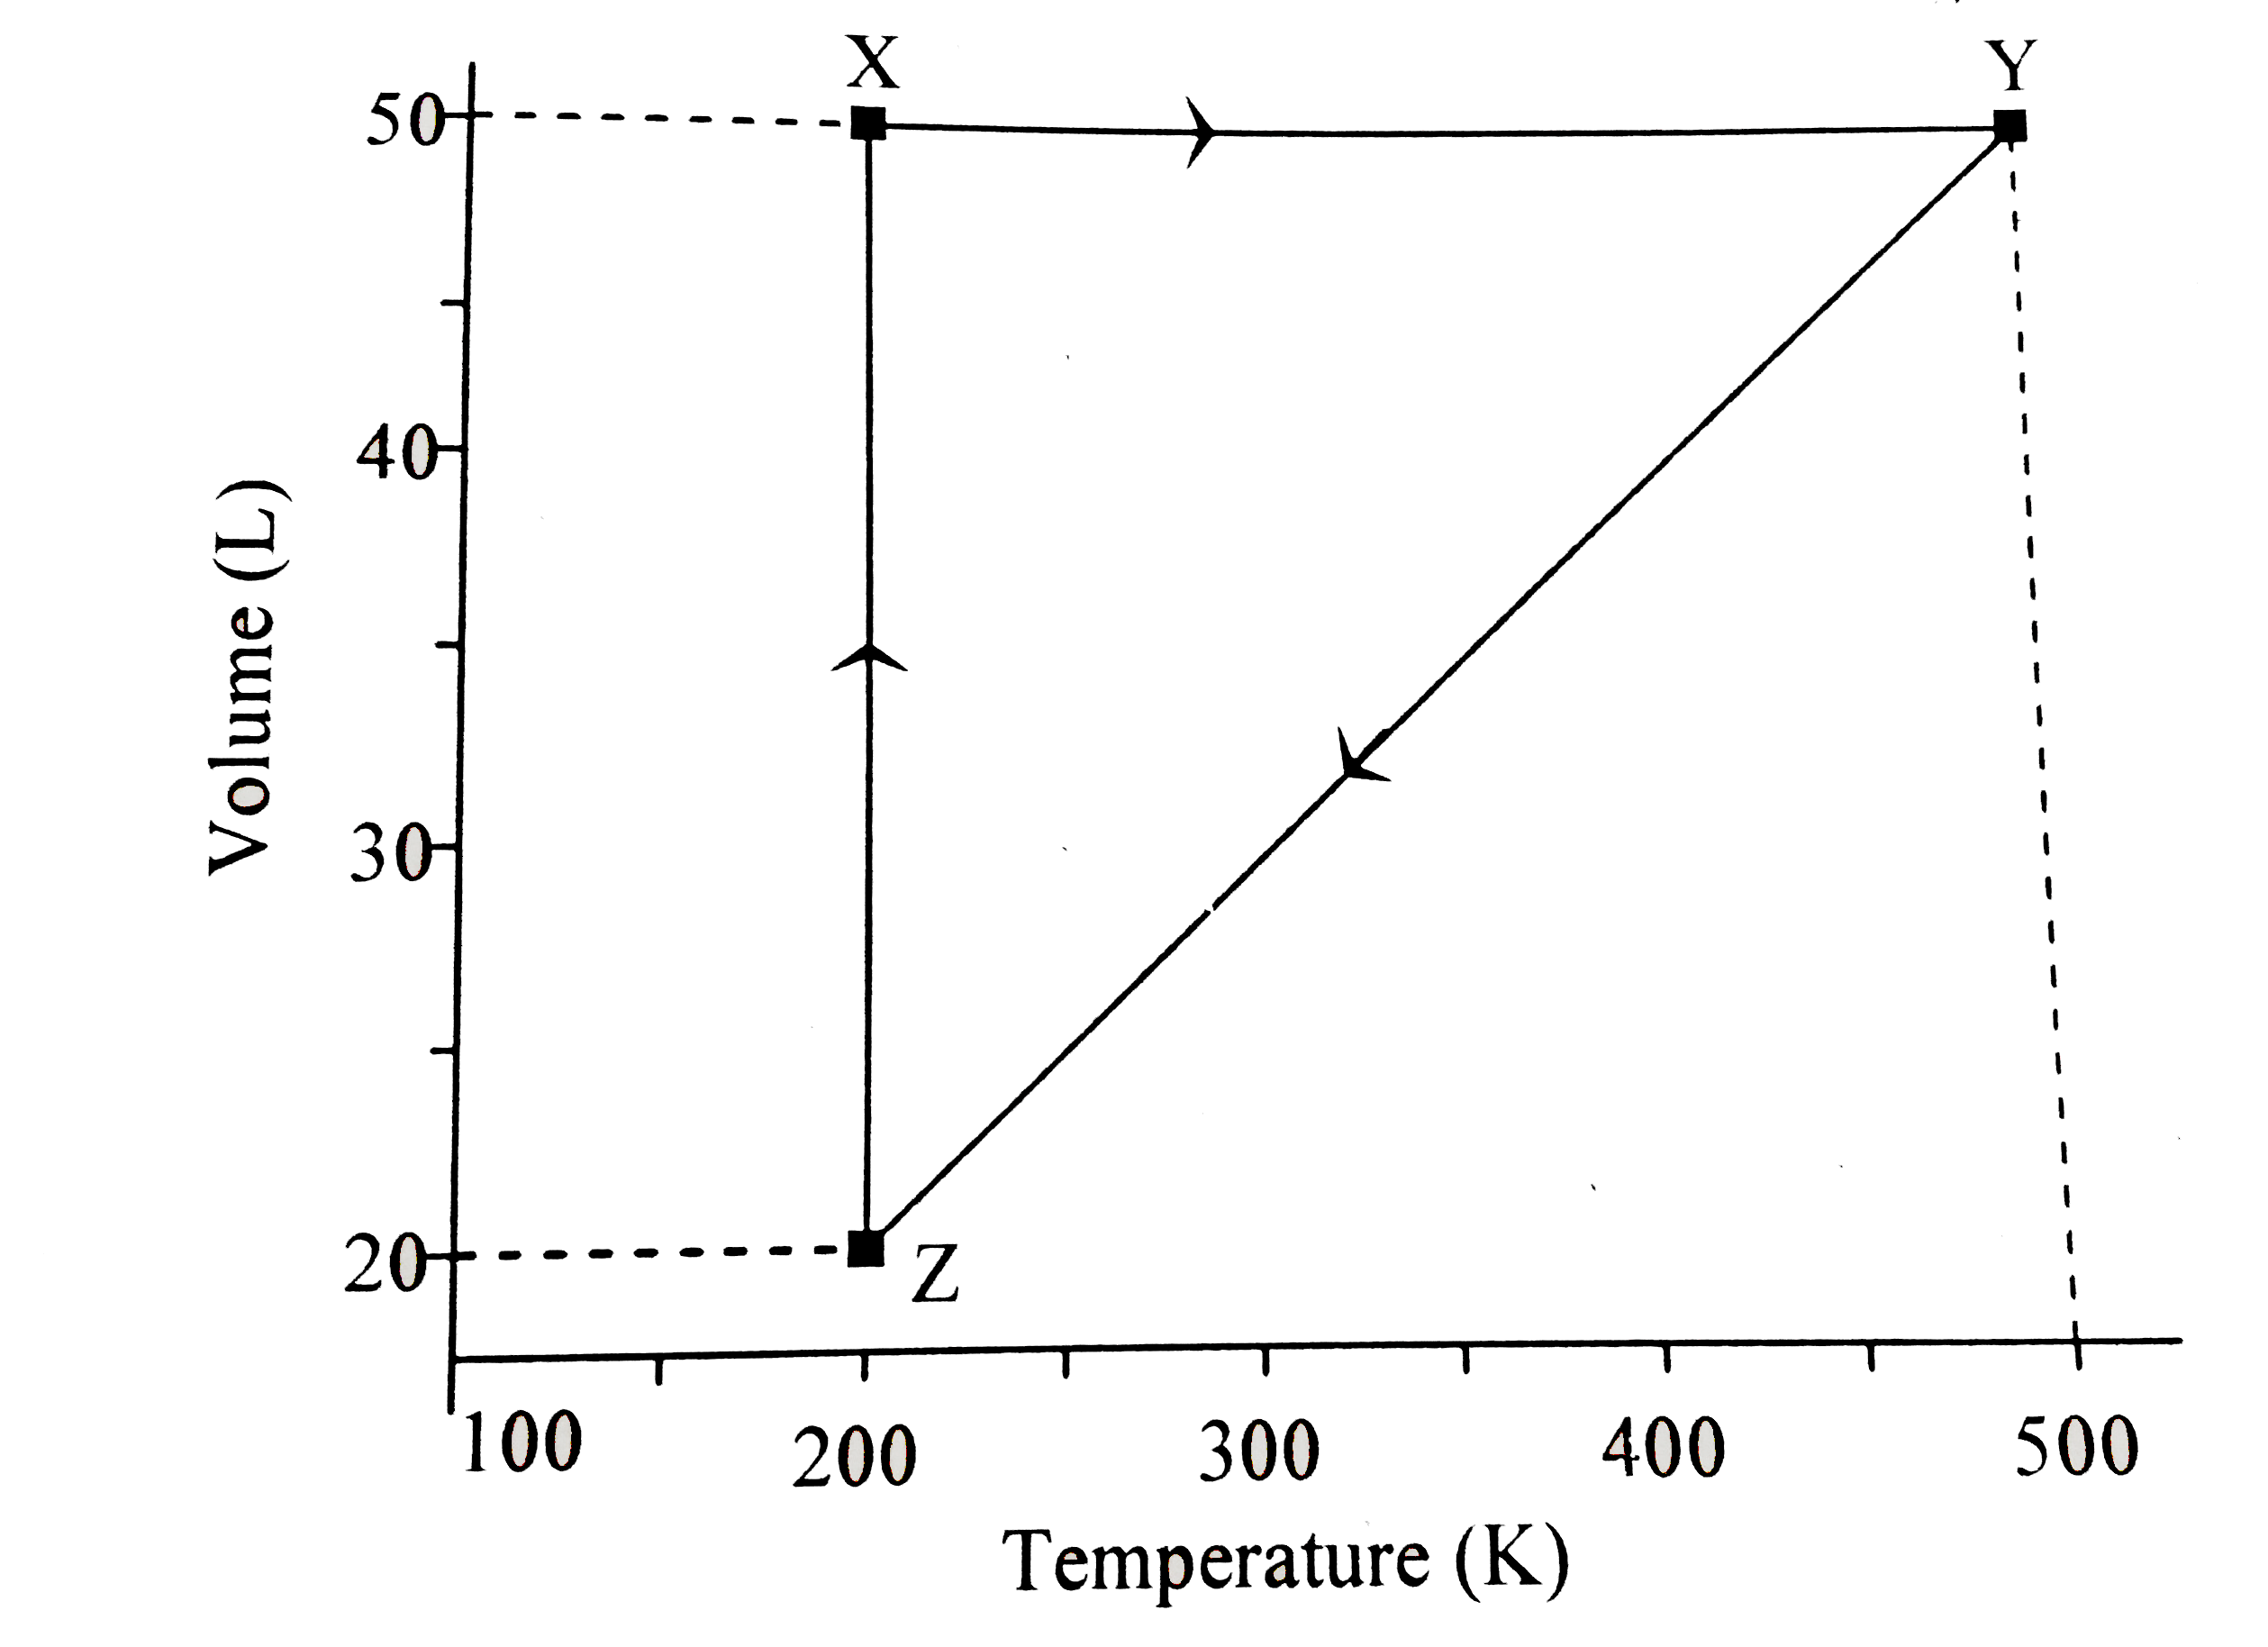
View SolutionThe volume vs. temperature graph of 1 mole of an ideal gas is given below

The pressure of the gas (in atm) at X, Y and Z, respectively, are04:01View SolutionAt constant temperature of 273K. (1)/(v) vs are plotted for two ideal gases A & B as shown below. Ratio of number of moles of gas A & B are
02:50View SolutionWhich of the following volume (V)-temperature (T) plots represents the behaviour of one mole of an ideal gas at one atmoshperic pressure?
00:54View SolutionPlot density vs pressure for a fixed mass of an ideal gas at a constant temperature.
05:16View SolutionWhich of the following volume (V) temperature (T) plots represents the behaviour of one mole of an ideal gas at one atmospheric pressure:
03:32View SolutionA graph is plotted between p (atm) vs t^(@)C for 10 mol of an ideal gas as follows: Then slope of curve and volume of container (L) respectively, are:
03:28View SolutionFor two samples of ideal gases A and B curves are plotted n vs V (volume of container ) at 16.42 atm pressure. Then temperature of A and B respectively are:

(a)200√3K,200√3K
(b)200√3∘C,(200√3)∘C
(c)200√3K,200√3K
(d)200K,√3200K05:26View Solution

