निम्नांकित सारणी में एक कम्पनी द्वारा उत्पादित कर योग्य और गैर कर योग्य वस्तुओं की संख्या का वर्ष वार अनुपात दिया गया है। प्रत्येक वर्ष कम्पनी के कुल उत्पादन में वृद्धि होती है।
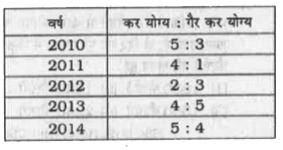
वर्ष और में उत्पादित कर योग्य उत्पादों तथा वर्ष और में उत्पादित गैर कर योग्य उत्पादों का अनुपात ज्ञात कीजिए।
The correct Answer is:B
Step by step video, text & image solution for निम्नांकित सारणी में एक कम्पनी द्वारा उत्पादित कर योग्य और गैर कर योग्य वस्तुओं की संख्या का वर्ष वार अनुपात दिया गया है। प्रत्येक वर्ष कम्पनी के कुल उत्पादन में 10% वृद्धि होती है। वर्ष 2011 और 2012 में उत्पादित कर योग्य उत्पादों तथा वर्ष 2011 और 2012 में उत्पादित गैर कर योग्य उत्पादों का अनुपात ज्ञात कीजिए। by Maths experts to help you in doubts & scoring excellent marks in Class 14 exams.
Similar Questions
The table given below shows the number of units of a product produced and sold by a company in 6 years.
निम्न तालिका एक कंपनी द्वारा छह वर्षों के दौरान उत्पादित और बेचे गए उत्पाद की यूनिटों की संख्या दर्शाती है|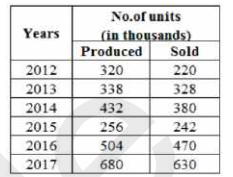 Find the ratio of the total number of units sold in 2013 and 2015 to the number of units produced in
2015 and 2016?
2013 और 2015 में बेची गई उत्पाद के यूनिटों की कुल संख्या तथा 2015 और 2016 में उत्पादित यूनिटों की संख्या का अनुपात ज्ञात कीजिए ?03:09View SolutionThe table given below shows the number of units of a product produced and sold by a company in 6 years.
निम्न तालिका एक कंपनी द्वारा छह वर्षों के दौरान उत्पादित और बेचे गए उत्पाद की यूनिटों की संख्या दर्शाती है|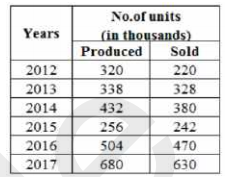 In which year, the production of product units is about 31.4% lower than units sold in 2017?
किस वर्ष में, उत्पाद की यूनिटों का उत्पादन 2017 में बेची गई यूनिटों की तुलना में लगभग 31.4% कम है ?04:39View SolutionStudy the chart and answer the questions:
In which of the given years is the percentage increase in the number of hotels in comparison to the previous year, is the maximum?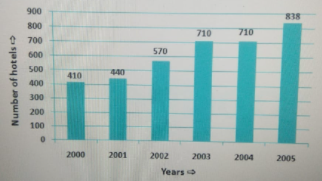
चार्ट का अध्ययन करें और प्रश्नों का उत्तर दें:पिछले वर्ष की तुलना में होटलों की संख्या में किस वर्ष में अधिकतम प्रतिशत वृद्धि हुई है?03:22View SolutionStudy the following bar diagram and answer the question that follows.
निम्नलिखित दंड आरेख का अध्ययन करें और उस प्रश्न का उत्तर दें जो पूछा गया है। The production (in thousands) of electronic items (TV and LCD) in a factory during the period from 2011 to 2015.
2011 से 2015 की अवधि के दौरान एक कारखाने में इलेक्ट्रॉनिक वस्तुओं (TV और LCD) का उत्पादन (हजारों में)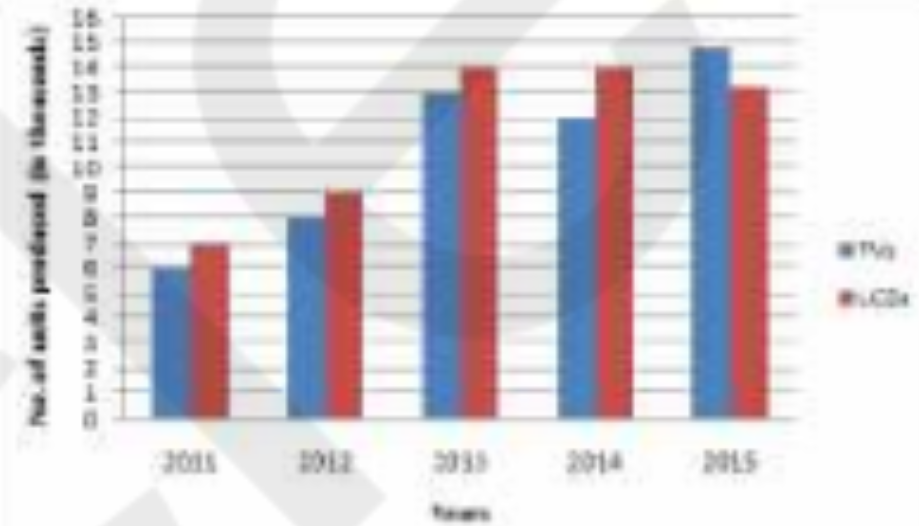 The ratio of the total production of LCDs in the year 2012 and 2014 to the total production of TV’s in the year 2012 and 2014 is:
वर्ष 2012 और 2014 में एलसीडी के कुल उत्पादन और वर्ष 2012 और 2014 में टीवी के कुल उत्पादन का अनुपात है:02:18View Solutionकिसी निश्चित समयावधि में किसी देश में उत्पादित वस्तुओं और सेवाओं के कुल मूल्य को क्या कहते हैं?
View SolutionStudy the following bar diagram carefully and answer the following questions :
निम्नलिखित आरेख का ध्यानपूर्वक अध्ययन करें और दिए गए प्रश्नों का उत्तर दें:
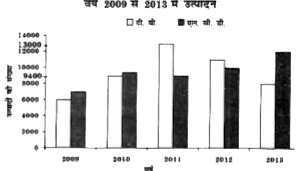
The ratio of production of LCDs in the year 2011 and 2013 is.
वर्ष 2011 और 2013 में एल. सी. डी. के उत्पादन का अनुपात है02:05View SolutionThe percentage of the total production of flavour R in 2007 and 2008 with respect to the production of flavour P in 2005 and 2006 is : वर्ष 2007 तथा 2008 में गन्ध R का कुल उत्पादन, वर्ष 2005 तथा 2006 में गन्ध P के उत्पादन की तुलना में कितने प्रतिशत रहा है?
02:05View SolutionStudy the chart carefully and answer the questions. The chart shows production of an item (in tones) during certain years. The production in 2006-07 in comparison to the production in 2002-03 increased by. निम्न आरेख का ध्यानपूर्वक अध्ययन कर दिए गए प्रश्नों के उत्तर दें: आरेख किसी वर्ष के दौरान एक मद का उत्पादन (टनों में) दर्शाता है। वर्ष 2002-03 की तुलना में 2006-07 में उत्पादन में वृद्धि हुई -
01:14View Solution

