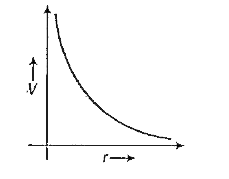
Draw a graph showing the variation of potential with distance from a point of charge.
Potential due to a point charge is given by V=q4πε0r
where, V∝1r

Similar Questions
Draw a graph to show the variation of E with perpendicular distance r from line of charge.
View SolutionDraw a graph showing the variation of stopping potential with frequency of the incident on a metal plate. How can the value of Planck's constant be determined from this graph?
View SolutionDraw a graph showing the variation of stopping potential with frequency of the incident radiation. What does the slope of the line with frequency axis indicate? What information can be obtained from the values of intercept on the potential axis?
View SolutionDraw a plot showing variation of electric field with distance from the centre of a solid conducting sphere of radius R having a charge Q on its surface.
View SolutionDraw a graph showing the variation of potential energy between a pair of nucleons as a function of their separation. Indicate the regions in which the nuclear force is (i) attractive, (ii) repulsive.
View SolutionDraw a graph showing the variation of de Broglie wavelength of a particle of charge q and mass m with accelerating potential. Proton and deuteron have the same de Broglie wavelengths. Explain which has more kinetic energy.
View SolutionDraw a graph showing the variation of de Broglie wavelength of a particle of charge q and mass m with accelerating potential. Proton and deuteron have the same de Broglie wavelengths. Explain which has more kinetic energy.
View SolutionDefine photoelectric effect. Draw a graph to show the variation of stopping potential with frequency of incident radiation on a metal plate.
View SolutionA thin long conductor has linear charge density of 20 μC/m. Calculate the electric field intensity at a point 5 cm from it. Draw a graph to show variation of electric field intensity with distance from the conductor.
View SolutionDraw a graph showing the variation of decay rate with number of active nuclei.
View Solution

