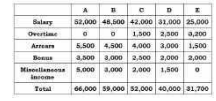
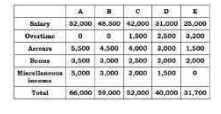
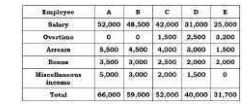
The following table shows the income (in rupees) for a particular month, together with their source, in respect of 5 employees(A,B,C,D and E).
निम्नलिखित तालिका 5 कर्मचारियों ( A.B, C, D तथा E) के संबंध में एक विशेष माह की आय तथा उसके स्रोत को दर्शाती है।
 How many employees got more arrears than the average arrears received by all the employees?
कितने. कर्मचारियों को. सभी कर्मचारियों को मिलने वाले औसत बकाया से अधिक बकाया राशि मिली है ?
2
1
4
3
The correct Answer is:D
Step by step video, text & image solution for The following table shows the income (in rupees) for a particular month, together with their source, in respect of 5 employees(A,B,C,D and E). निम्नलिखित तालिका 5 कर्मचारियों ( A.B, C, D तथा E) के संबंध में एक विशेष माह की आय तथा उसके स्रोत को दर्शाती है। How many employees got more arrears than the average arrears received by all the employees? कितने. कर्मचारियों को. सभी कर्मचारियों को मिलने वाले औसत बकाया से अधिक बकाया राशि मिली है ? by Maths experts to help you in doubts & scoring excellent marks in Class 14 exams.
Similar Questions
The following table shows the income (in ₹) for a particular month, together with their source, in respect of 5 employees(A,B,C,D and E).
निम्नलिखित तालिका 5 कर्मचारियों (A, B, C, D तथा E ) के संबंध में एक विशेष माह की आय ( रुपये में ) तथा उसके स्रोत को दर्शाती है | How many employees got more than a total of ₹ 10,000 as income other than salary?
कितने कर्मचारियों को वेतन के अतिरिक्त कुल 10,000 रुपये से अधिक की आय हुई है ?View SolutionThe following table shows the income (in rupees) for a particular month, together with their source, in respect of 5 employees(A,B,C,D and E)
निम्नलिखित तालिका 5 कर्मचारियों (A, B, C, D तथा E) के संदर्भ में एक विशेष महीने की आय तथा उसके स्रोत को दर्शाती है | For employee D, the income from overtime is what percentage of his total income?
कर्मचारी D के लिए, ओवरटाइम से होने वाली आय उसकी कुल आय का कितना प्रतिशत है ?View Solution
Knowledge Check
- Question 1 - Select One
The following table shows the income (in ₹) for a particular month, together with their source, in respect of 5 employees(A,B,C,D and E).
निम्नलिखित तालिका 5 कर्मचारियों (A, B, C, D तथा E ) के संबंध में एक विशेष माह की आय ( रुपये में ) तथा उसके स्रोत को दर्शाती है | How many employees got more than a total of ₹ 10,000 as income other than salary?
कितने कर्मचारियों को वेतन के अतिरिक्त कुल 10,000 रुपये से अधिक की आय हुई है ?A3B2C4D1 - Question 2 - Select One
The following table shows the income (in rupees) for a particular month, together with their source, in respect of 5 employees(A,B,C,D and E).
निम्नलिखित तालिका 5 कर्मचारियों ( A.B, C, D तथा E) के संबंध में एक विशेष माह की आय तथा उसके स्रोत को दर्शाती है। How many employees got more arrears than the average arrears received by all the employees?
कितने. कर्मचारियों को. सभी कर्मचारियों को मिलने वाले औसत बकाया से अधिक बकाया राशि मिली है ?A2B1C4D3 - Question 3 - Select One
The table below shows income (in rupees) for a particular month, together with their sources in नीचे दी गयी तालिका 5 कर्मचारियों - A, B, C, D और E की एक विशेष माह में विभिन्न स्रोतों से होने वाली आय को दर्शाती है |
 How many employees have their salary more than four times their other income?
कितने कर्मचारियों का वेतन उनकी अन्य आय के चार गुना से अधिक है ?A2B4C3D1
The table below shows income (in rupees) for a particular month, together with their sources in नीचे दी गयी तालिका 5 कर्मचारियों - A, B, C, D और E की एक विशेष माह में विभिन्न स्रोतों से होने वाली आय को दर्शाती है |
 How many employees have their salary more than four times their other income?
कितने कर्मचारियों का वेतन उनकी अन्य आय के चार गुना से अधिक है ?View SolutionThe following table shows the daily earnings of 45 skilled workers: How many workers earn less than ₹ 1,100 in a day?
निम्नलिखित तालिका 45 कुशल श्रमिकों की दैनिक आय को दर्शाती है |
कितने श्रमिक एक दिन में 1,100 रुपये से कम कमाते हैं ?View SolutionIn the following table, the mean and S.D. of the income of the employees of two factories are given. Find the variability of their average income.
 View Solution
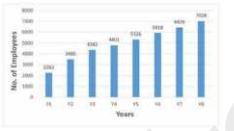
The Bar graph shown below presents the number of employees in an office during eight consecutive years.
नीचे दिया गया दंड आरेख किसी कार्यालय में आठ लगातार वर्षों के दौरान कर्मचारियों की संख्या को दर्शाता है |
The number of employees in year Y2 is how much percent less than the average number of employees per year?
वर्ष Y2 में कर्मचारियों की संख्या प्रति वर्ष कर्मचारियों की औसत संख्या से कितना प्रतिशत कम है ?View SolutionThe following table shows the percentage distribution of the population of five states, A,B,C,D and E on the basis of the poverty line and also on the basis of sex.
निम्नलिखित तालिका गरीबी रेखा तथा लिंग के आधार पर पाँच राज्यों A,B,C, D तथा E की आबादी के प्रतिशत वितरण को दर्शाती है | If the male population above the poverty line for State B is 2.5 million, then what is the total population of State B?
यदि B राज्य में गरीबी रेखा से ऊपर पुरुष आबादी 25 लाख है, तो राज्य B की कुल आबादी कितनी है ?View Solution

