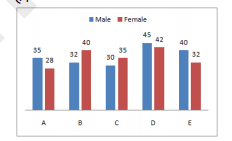
The following table shows the percentage distribution of the population of five states, A,B,C,D and E on the basis of the poverty line and also on the basis of sex.
निम्नलिखित तालिका गरीबी रेखा तथा लिंग के आधार पर पाँच राज्यों A,B,C, D तथा E की आबादी के प्रतिशत वितरण को दर्शाती है |
 If the male population above the poverty line for State B is 2.5 million, then what is the total population of State B?
यदि B राज्य में गरीबी रेखा से ऊपर पुरुष आबादी 25 लाख है, तो राज्य B की कुल आबादी कितनी है ?
813 million
823 million
723 million
1053 million
Step by step video & image solution for The following table shows the percentage distribution of the population of five states, A,B,C,D and E on the basis of the poverty line and also on the basis of sex. निम्नलिखित तालिका गरीबी रेखा तथा लिंग के आधार पर पाँच राज्यों A,B,C, D तथा E की आबादी के प्रतिशत वितरण को दर्शाती है | If the male population above the poverty line for State B is 2.5 million, then what is the total population of State B? यदि B राज्य में गरीबी रेखा से ऊपर पुरुष आबादी 25 लाख है, तो राज्य B की कुल आबादी कितनी है ? by Maths experts to help you in doubts & scoring excellent marks in Class 14 exams.
Updated on:21/07/2023Topper's Solved these Questions
Similar Questions
The graphs of the equations 3x+y-5=0 and 2x-y-5=0 intersect at the point P(α,β). What is the value of (3α+β) ?
समीकरण 3x+y-5=0 तथा 2x-y-5=0 के आरेख एक बिंदु P(α,β) पर एक-दूसरे को काटते है (3α+β) का मान क्या है ?
View SolutionAfter giving two successive discounts, each of x%, on the marked price of an article, total discount is Rs. 259.20. If the marked price of the article is Rs. 720, then the value of x is :
View SolutionHow many lines of symmetry does the above figure have ?
View Solution
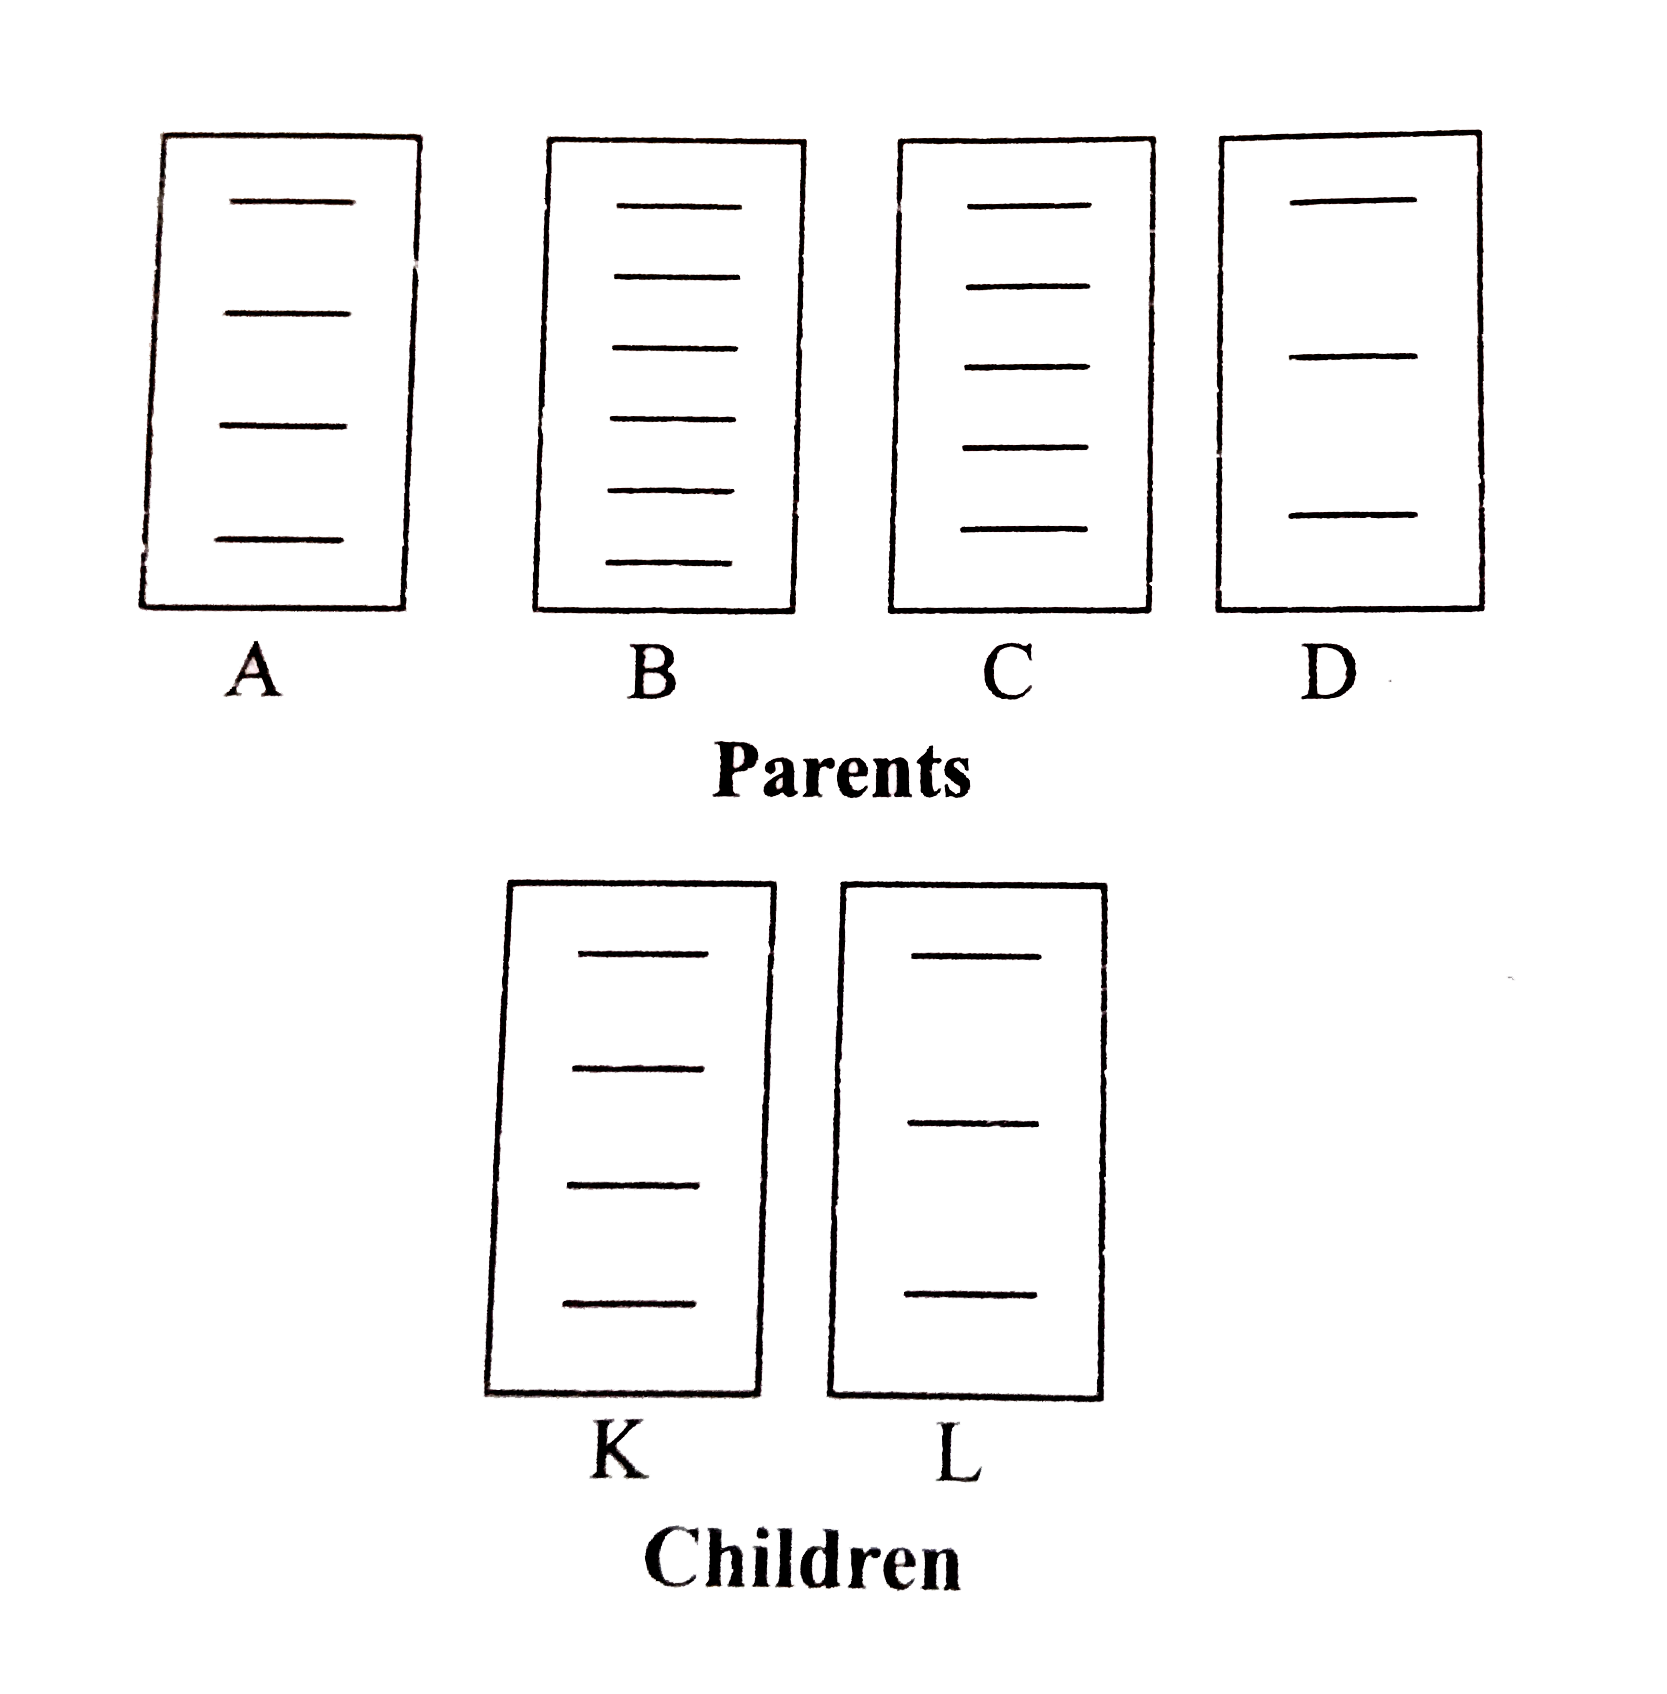
On the basis of given DNA fingerprint, match the children's (K and L) with their respective parent (A, B, C, and D).
View SolutionDetermine the point of symmetry of a regular hexagon.
View SolutionDtermine the images of the following figure about the given line :
View SolutionMatch the following Column A to Column B

View SolutionThe inequation represented by the graph given below is :
View SolutionThe inequation that best describes the following graph is _________
View SolutionThe following table shows the percentage distribution of the population of five states, A,B,C,D and E on the basis of the poverty line and also on the basis of sex.
निम्नलिखित तालिका गरीबी रेखा तथा लिंग के आधार पर पाँच राज्यों A,B,C, D तथा E की आबादी के प्रतिशत वितरण को दर्शाती है | If the population of males below the poverty line for State C is 3 million, then what is the total
population of State C?
यदि राज्य C में गरीबी रेखा से नीचे पुरुषों की आबादी 30 लाख है, तो राज्य C की कुल आबादी कितनी है ?
View SolutionThe following graph gives the details of the male and female population (in thousands) across five places A, B, C, D and E.
निम्नलिखित आरेख पाँच स्थानों A, B,C, D और E में पुरुष और महिला आबादी ( हज़ार में) का विवरण देता | Based on the information, the total number of females in all five places is approximately what
percentage of the total number males in all five places?
इस जानकारी के आधार पर, सभी पाँच स्थानों पर महिलाओं की कुल संख्या सभी पाँच स्थानों पर पुरुषों की कुल संख्या का लगभग कितना प्रतिशत है?
View SolutionThe array below shows the percentage of people living below the poverty line (BPL) and the ratio of the number of men and women living above the poverty line (APL) in 6 states. If the number of males living below poverty line in state A is 3000 and in E this number is 6000, then what is the ratio of the population of these states respectively?
View SolutionPercentage of the number of persons living below the poverty line and the ratio of the number of men and women in 6 states. If the total population of states C and D is 20000, then how many males are living below poverty line in state C?
View SolutionIdentify A,B,C and D,E
View SolutionConsider the following reactions.
View Solution
