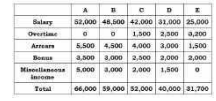
The following table shows the income (in rupees) for a particular month, together with their source, in respect of 5 employees(A,B,C,D and E)
निम्नलिखित तालिका 5 कर्मचारियों (A, B, C, D तथा E) के संदर्भ में एक विशेष महीने की आय तथा उसके स्रोत को दर्शाती है |
 For employee D, the income from overtime is what percentage of his total income?
कर्मचारी D के लिए, ओवरटाइम से होने वाली आय उसकी कुल आय का कितना प्रतिशत है ?
0.05
0.075
0.0625
0.225
Step by step video & image solution for The following table shows the income (in rupees) for a particular month, together with their source, in respect of 5 employees(A,B,C,D and E) निम्नलिखित तालिका 5 कर्मचारियों (A, B, C, D तथा E) के संदर्भ में एक विशेष महीने की आय तथा उसके स्रोत को दर्शाती है | For employee D, the income from overtime is what percentage of his total income? कर्मचारी D के लिए, ओवरटाइम से होने वाली आय उसकी कुल आय का कितना प्रतिशत है ? by Maths experts to help you in doubts & scoring excellent marks in Class 14 exams.
Updated on:21/07/2023Topper's Solved these Questions
Similar Questions
The graphs of the equations 3x+y-5=0 and 2x-y-5=0 intersect at the point P(α,β). What is the value of (3α+β) ?
समीकरण 3x+y-5=0 तथा 2x-y-5=0 के आरेख एक बिंदु P(α,β) पर एक-दूसरे को काटते है (3α+β) का मान क्या है ?
View SolutionAfter giving two successive discounts, each of x%, on the marked price of an article, total discount is Rs. 259.20. If the marked price of the article is Rs. 720, then the value of x is :
View SolutionIn the given figure (not to scale), O is the centre of the circle. A,B,C and D are concyclic and AB=CD . If /_MON =120^(@) , then find /_ OPN .
View SolutionDetermine the point of symmetry of a regular hexagon.
View SolutionMatch the following Column A to Column B

View SolutionMatch the following Column A to Column B

View SolutionMatch the following Column A to Column B

View SolutionThe inequation represented by the graph given below is :
View SolutionThe inequation that best describes the graph given below is _________
View SolutionThe inequation that best describes the following graph is _________
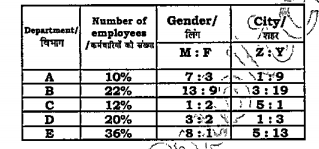
View SolutionThe given table shows the number (in percent) of employees working in different depratments of an organization. The table also shows the ratio of males and females and the ratio of employees living in city Z and employees , living in city Y. The total number of employees in the organization 80,000.
दी गई तालिका में एक संगठन के विभिन्न विभागों में कार्य कर रहे कर्मचारियों की संख्या ( प्रतिशत में ) को दर्शाया गया है। यह तालिका पुरूषों तथा महिलाओं के अनुपाव को तथा शहर ,Z में रह रहे कर्मचारियों तथा शहर Y में रह रहे कर्मचारियों के अनुपात को भी दर्शाती है। संगठन रद में कुल कर्मचारियों की संख्या 80000 है। How many employees of department A and C together are living in city Z?
विभाग A तथा C के कितने कर्मचारी, शहर Z में साथ-मिलकर रह रहें है?
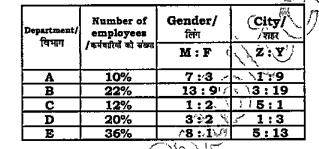
View SolutionThe given table shows the number (in percent) of employees working in different depratments of an organization. The table also shows the ratio of males and females and the ratio of employees living in city Z and employees , living in city Y. The total number of employees in the organization 80,000.
दी गई तालिका में एक संगठन के विभिन्न विभागों में कार्य कर रहे कर्मचारियों की संख्या ( प्रतिशत में ) को दर्शाया गया है। यह तालिका पुरूषों तथा महिलाओं के अनुपाव को तथा शहर ,Z में रह रहे कर्मचारियों तथा शहर Y में रह रहे कर्मचारियों के अनुपात को भी दर्शाती है। संगठन रद में कुल कर्मचारियों की संख्या 80000 है। What is the ratio of male employee working in department B and D together to female employee working in department A and E together?
विभाग B तथा D को मिलाकर कार्य कर रहे पुरूष कर्मचारियों का विभाग A तथा E को मिलाकर कार्य कर रही महिला कर्मचारियों से क्या अनुपात है?
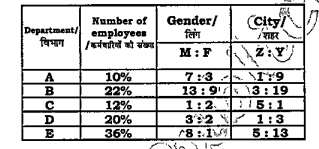
View SolutionThe given table shows the number (in percent) of employees working in different depratments of an organization. The table also shows the ratio of males and females and the ratio of employees living in city Z and employees , living in city Y. The total number of employees in the organization 80,000.
दी गई तालिका में एक संगठन के विभिन्न विभागों में कार्य कर रहे कर्मचारियों की संख्या ( प्रतिशत में ) को दर्शाया गया है। यह तालिका पुरूषों तथा महिलाओं के अनुपाव को तथा शहर ,Z में रह रहे कर्मचारियों तथा शहर Y में रह रहे कर्मचारियों के अनुपात को भी दर्शाती है। संगठन रद में कुल कर्मचारियों की संख्या 80000 है। what are the total number of employee in department A and E together?
विभाग A तथा E में मिलाकर कुल कर्मचारियों की संख्या क्या है?
View SolutionThe table below shows income (in rupees) for a particular month, together with their sources in नीचे दी गयी तालिका 5 कर्मचारियों - A, B, C, D और E की एक विशेष माह में विभिन्न स्रोतों से होने वाली आय को दर्शाती है | How many employees have their salary more than four times their other income? कितने कर्मचारियों का वेतन उनकी अन्य आय के चार गुना से अधिक है ?
View SolutionThe following table shows the income (in rupees) for a particular month, together with their source, in respect of 5 employees(A,B,C,D and E).
निम्नलिखित तालिका 5 कर्मचारियों ( A.B, C, D तथा E) के संबंध में एक विशेष माह की आय तथा उसके स्रोत को दर्शाती है। How many employees got more arrears than the average arrears received by all the employees?
कितने. कर्मचारियों को. सभी कर्मचारियों को मिलने वाले औसत बकाया से अधिक बकाया राशि मिली है ?
View Solution
