The given bar graph represents the Percentage of non-electrified villages in 6 states A, B, C, D, E and F. Study the graph and answer the question that follows.
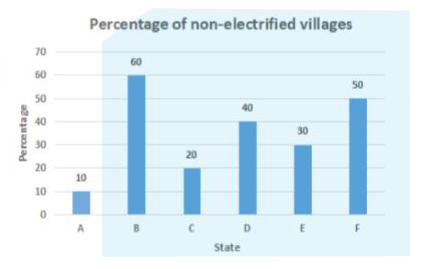
How many states have at most 30% or less non-electrified villages?
3
2
1
4
The correct Answer is:A
Step by step video & image solution for The given bar graph represents the Percentage of non-electrified villages in 6 states A, B, C, D, E and F. Study the graph and answer the question that follows. How many states have at most 30% or less non-electrified villages? by Maths experts to help you in doubts & scoring excellent marks in Class 14 exams.
Updated on:21/07/2023Similar Questions
The give graph represents the percentage distibution of the total expenditure of a company. Study the graph and answer the question that follows .
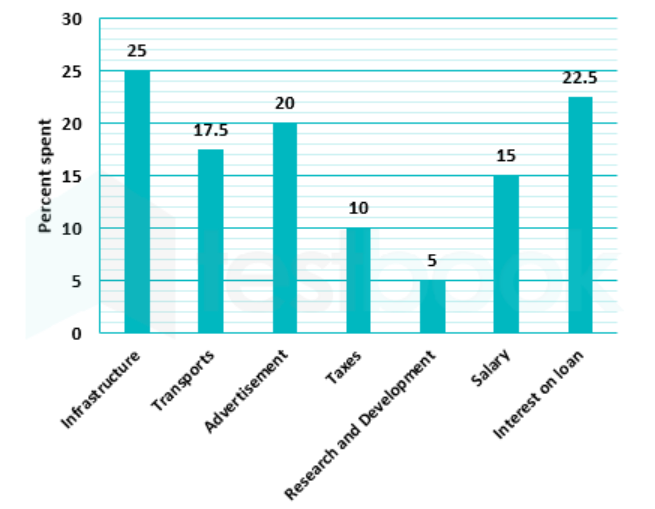
The total expenditure of the company is how many times the total expenditure on 'Research and Development' and 'Salary'?
View SolutionThe given bar graph represents the number of students who appeared in the board examination in session 2017-18 and 2018-19. Study the graph and answer the question that follows.
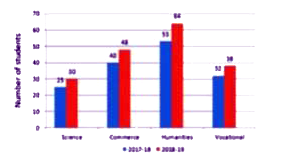
What percentage is the total number of students who appeared in 2017-18 is less than the total number of students who appeared in 2018-19?
View Solution
Knowledge Check
How many State have at least 50% electrified villages?
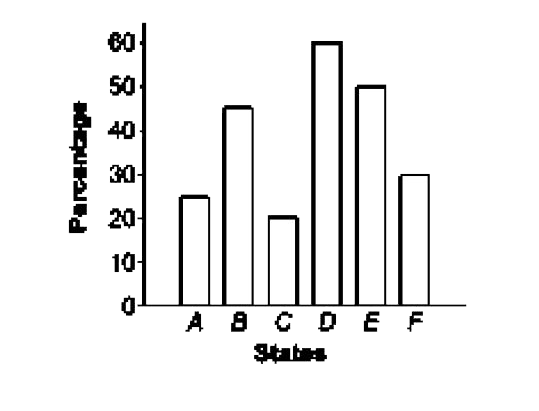 A1B2C3D5
The given bar graph represents the number of boys and girls in five different schools. Study the graph and answer the question that follows
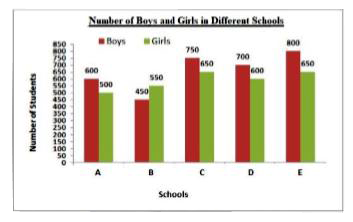
In which school is the percentage of girls the lowest ?AABBCEDCThe given bar graph represents the number of bodys and girls in five different schools. Study the graph and answer the question that follows
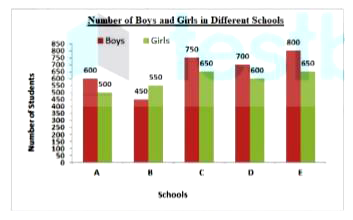
What is the average number of boys in schools A, B, C, D and E?A660B616C596D569
The given bar graph shows the number of tourists of various states. Study the graph and answer the question that follows.
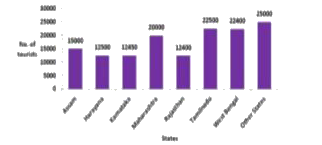
The number of tourists to which of the following states is less than 10% of the total number of tourist ?
View SolutionThe given bar graph represents the number of boys and girls in five different schools. Read the graph and answer the question that follows.
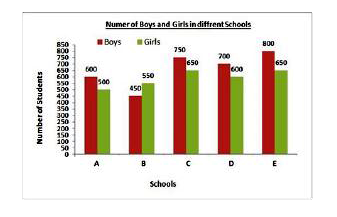
In which school is the percentage of boys more than 55%?
View SolutionIn the following questions, the followIng Bar Diagram shows the percentage of 7 coloured balls sold in 5 shops A, B, C, D and E. Study the graph and answer. all the questions.
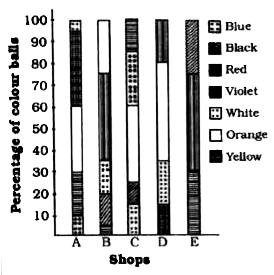
The shops having equal percentage of white balls are :
View SolutionIn the following questions, the followIng Bar Diagram shows the percentage of 7 coloured balls sold in 5 shops A, B, C, D and E. Study the graph and answer. all the questions.
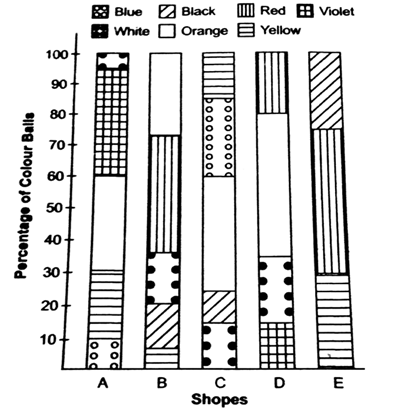
The ratio of total percentage of red balls and total percentage of orange balls is :
View SolutionIn the following questions, the followIng Bar Diagram shows the percentage of 7 coloured balls sold in 5 shops A, B, C, D and E. Study the graph and answer. all the questions.
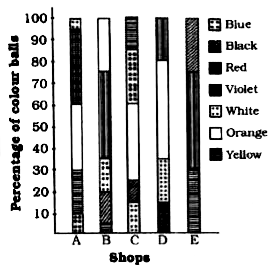
What fraction of the total percentage of colour balls is to the percentage of total yellow balls?
View Solution
