The given bar graph represents the number of teachers in different weight groups. Study the graph and answer the questions that follows
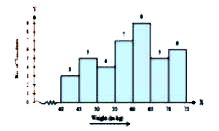
In which the following weight groups in the number of teachers the maximum
45-50
60-65
65-70
40-45
The correct Answer is:B
Step by step video, text & image solution for The given bar graph represents the number of teachers in different weight groups. Study the graph and answer the questions that follows In which the following weight groups in the number of teachers the maximum by Maths experts to help you in doubts & scoring excellent marks in Class 14 exams.
Updated on:21/07/2023Similar Questions
The given bar graph shows the number of tourists of various states. Study the graph and answer the question that follows.
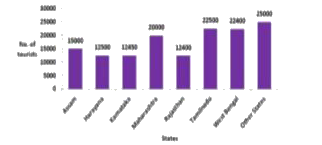
The number of tourists to which of the following states is less than 10% of the total number of tourist ?
View SolutionThe given bar graph represents the number of students who appeared in the board examination in session 2017-18 and 2018-19. Study the graph and answer the question that follows.
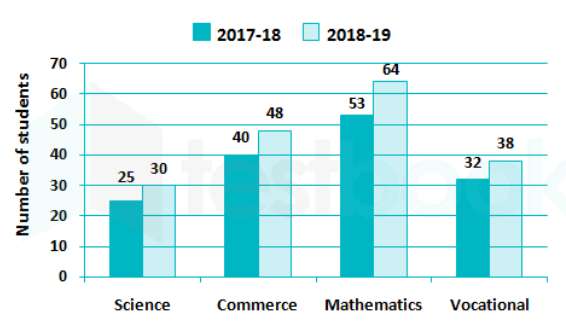
The difference between the average number of students of Science and Mathematics streams in 2017-2018 and that in Commerce and Vocational in 2018-19, is:
View Solution
Knowledge Check
Study the following bar graph and answer the question that follows.
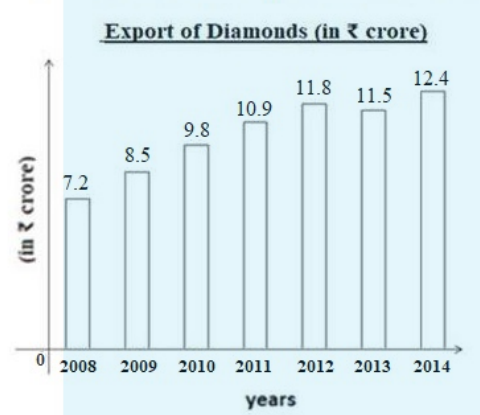
In which year was the maximin percentage increase in diamonds exports compared to the previous year?A2014B2009C2010D2012The given bar graph represents the number of boys and girls in five different schools. Study the graph and answer the question that follows
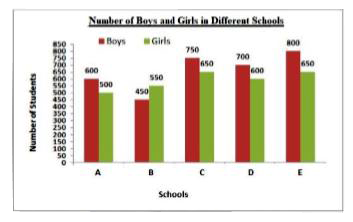
In which school is the percentage of girls the lowest ?AABBCEDCThe given bar graph shows the biscuit exports of India over a period of five years. Study the graph and answer the questions that follows
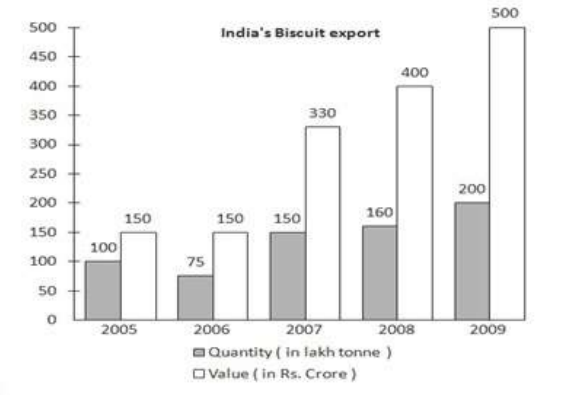
In which two year was the value per tonne equal?A2006 and 2007B2008 and 2009C2007 and 2008D2005 and 2006
The given bar graph represents the number of students who appeared in the board examination in session 2017-18 and 2018-19. Study the graph and answer the question that follows.
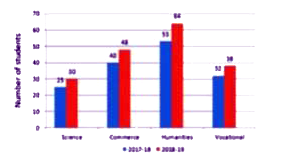
What percentage is the total number of students who appeared in 2017-18 is less than the total number of students who appeared in 2018-19?
View SolutionThe given bar graph represents the number of boys and girls in five different schools. Read the graph and answer the question that follows.
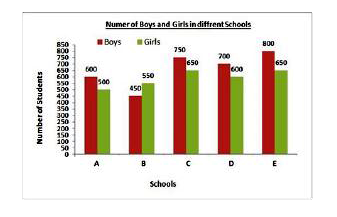
In which school is the percentage of boys more than 55%?
View SolutionThe given bar graph represents the number of bodys and girls in five different schools. Study the graph and answer the question that follows
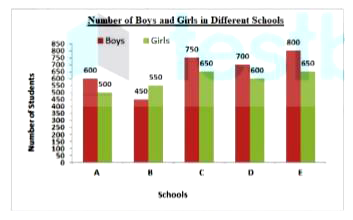
What is the average number of boys in schools A, B, C, D and E?
View SolutionThe given bar graph represents the number of boys and girls in five different schools. Read the graph and answer the question that follows.
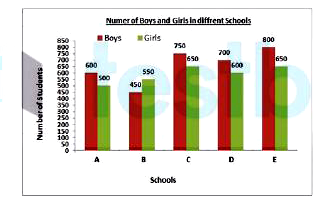
What is the average number of students (girls and boys) in schools A, B, C, D and E ?
View SolutionThe bar graph shows the number of soldiers in the armies of different countries. Study the diagram and answer the following questions.
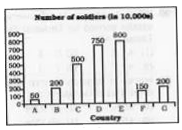
Which country has the least number of soldiers?
View Solution
