Read the information given below and answer the questions that follow:
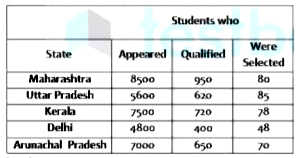
Following table gives the data on the number of students who appeared, qualified and were selected from various states in a national level exam.
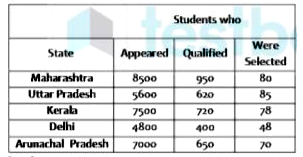
What percentage of students who appeared in the exam were selected?
1.08%
0.90%
1.2%
2.11%
The correct Answer is:A
Step by step video, text & image solution for Read the information given below and answer the questions that follow: Following table gives the data on the number of students who appeared, qualified and were selected from various states in a national level exam. What percentage of students who appeared in the exam were selected? by Maths experts to help you in doubts & scoring excellent marks in Class 14 exams.
Similar Questions
The following questions are based on the information given below. Read the information given below and answer the question that follow: Information about the Number of Candidates who appeared, qualified and then were selected in a Competitive Examination from Delhi over the years 1997 to 2001 is given below:
 For which year is the ratio of number of candidates who were selected to the number of candidates who qualified the highest?
(A) 1998 (B) 2000 (C ) 2001 (D) 1999View SolutionThe following questions are based on the information given below. Read the information given below and answer the question that follow: Information about the Number of Candidates who appeared, qualified and then were selected in a Competitive Examination from Delhi over the years 1997 to 2001 is given below:
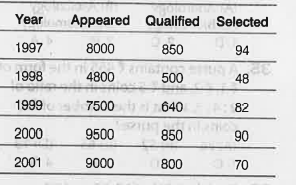 What is the average numer of candidates selected over the given period (round it to the nearest integers)?
(A) 79 (B) 77 (C ) 76 (D) 74View Solution
Knowledge Check
- Question 1 - Select One
Read the information given below and answer the questions that follow:
Following table gives the data on the number of students who appeared, qualified and were selected from various states in a national level exam.
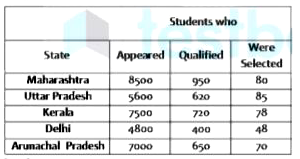
Which State has the lowest percentage of qualifications over those who had appeared?AA) MaharashtraBB) KeralaCC) DelhiDD) Arunachal Pradesh - Question 2 - Select One
Read the information given below and answer the questions that follow:
Following table gives the data on the number of students who appeared, qualified and were selected from various states in a national level exam.
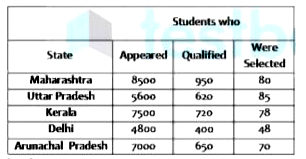
Which State has the highest ratio of number of students selected to the number of students who appeared from that State?AMaharashtraBDelhiCUttar PradeshDKerala - Question 3 - Select One
Read the information given below and answer the questions that follow:
Following table gives the data on the number of students who appeared, qualified and were selected from various states in a national level exam.
Which State has the highest ratio of number of students selected to the who qualified selectedAMaharashtraBDelhiCUttar PradeshDKerala
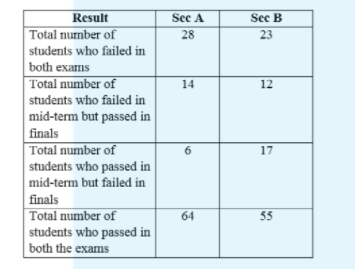
The following table gives the details of the number of students in Class 10 section A and B who had taken mid-term and final exam. The percentage of students in section A is _________ (round to one decimal).
 View Solution
The given bar graph represents the number of students who appeared in the board examination in session 2017-18 and 2018-19. Study the graph and answer the question that follows.
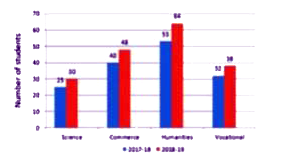
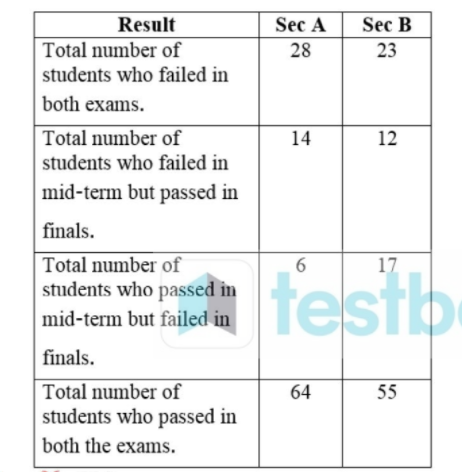
What percentage is the total number of students who appeared in 2017-18 is less than the total number of students who appeared in 2018-19?View SolutionThe below table gives the details of the number of students in Class 10, section A and B who had taken mid-term and final exam. What is the total number of students in both, section A and B?
 View Solution
The following graph shows the data of the number of candidates that appeared and qualified for a competitve exam from the colleges A , B,C,D,E .
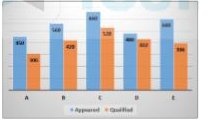
Based on the information , the difference between the percentage of students that qualified , from the colleges B and D is :View SolutionA total of 2,60,000 students appeared for class 10th exam in a state. If a total of 1,97,600 students pass the exam, what will be the percentage of students who failed in the exam?
View Solution

