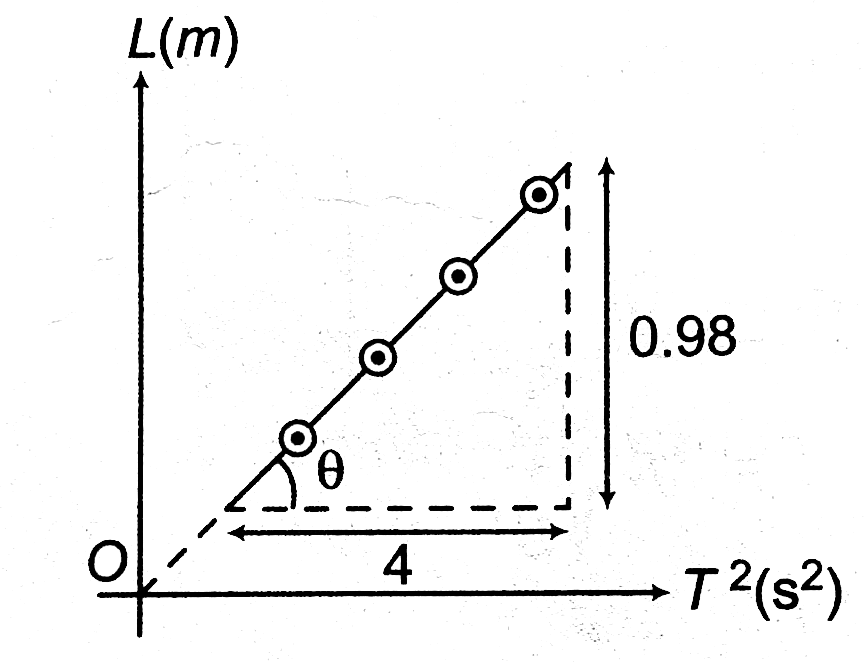
The graph between L and T2 is
A

B

C

D

Text Solution
The correct Answer is:A
|
Similar Questions
Knowledge Check
The graph between L and T is correctly shown by
A B
B C
C D
D
Assertion : For a simple pendlume the graph between ans T2 is hyperbola
Reason : T=2π√g1AIf both assertion and reason are true and the reasopn is correct explanation of the assertionBIf both assertion and reason are true and but not the correct explanation of assertionCIf assertion is true but the reason is falseDIf both assertion and reason are falseWhile determining the value of g using simple pendulum, we plot a graph between l and T2 which is
Aa straight lineBa parabolaCan ellipseDa circle
For different values of L, we get different values of T2. The graph between L versus T2 ia as shown in figure. Find the value of 'g' from the given graph.(Take (π)2=10).
 .
.
View SolutionThe graph between χ and T for paramagnetic material will be represented by
View SolutionThe graph between L and Tis correctly shown by (Fig. 7.2)
View SolutionThe graph between χ and T for paramagnetic material will be represented by
View SolutionThe graph between (P/T) and T for a gas at constant volume will be:
View Solution
