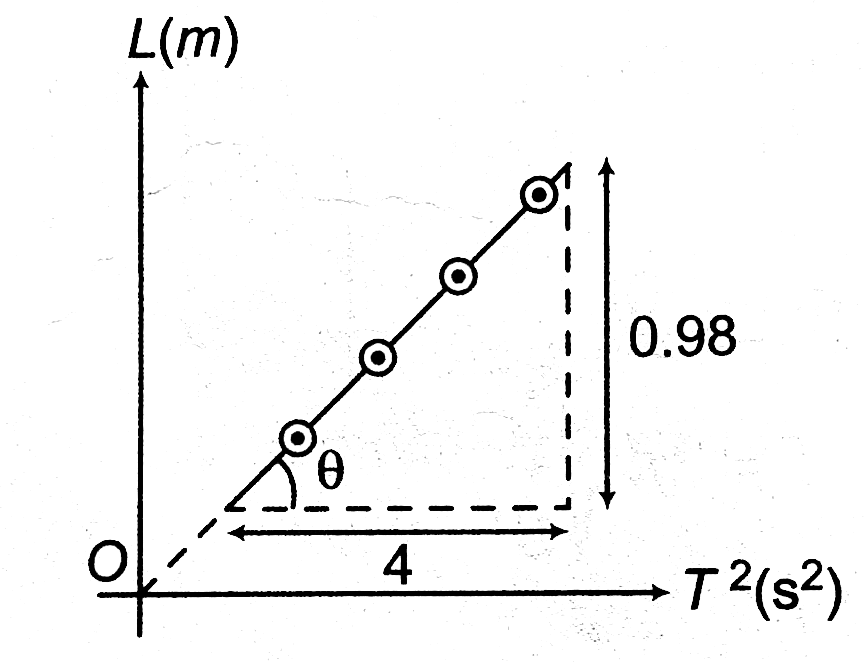
For different values of L, we get different values of T2. The graph between L versus T2 ia as shown in figure. Find the value of 'g' from the given graph.(Take (π)2=10).
 .
.
From the equation, T=2π√Lg
we get, L=(g4π2)T2⇒L∝T2
I,e. L versus T2 graph is a straight line passing through origin with slope=g4π2
∴ Slope=tanθ=g4π2 or g=(4π2)tanθ
=4×10×0.984=9.8m/s2.
Topper's Solved these Questions
- EXPERIMENTSBOOK - DC PANDEY ENGLISHCHAPTER - EXPERIMENTSEXERCISE - Exercise 3.1
2 Videos
- EXPERIMENTSBOOK - DC PANDEY ENGLISHCHAPTER - EXPERIMENTSEXERCISE - Exercise 3.2
2 Videos
- ELECTROSTATICSBOOK - DC PANDEY ENGLISHCHAPTER - ELECTROSTATICSEXERCISE - Integer
17 Videos
- FLUID MECHANICSBOOK - DC PANDEY ENGLISHCHAPTER - FLUID MECHANICSEXERCISE - Medical entranes gallery
49 Videos
Similar Questions
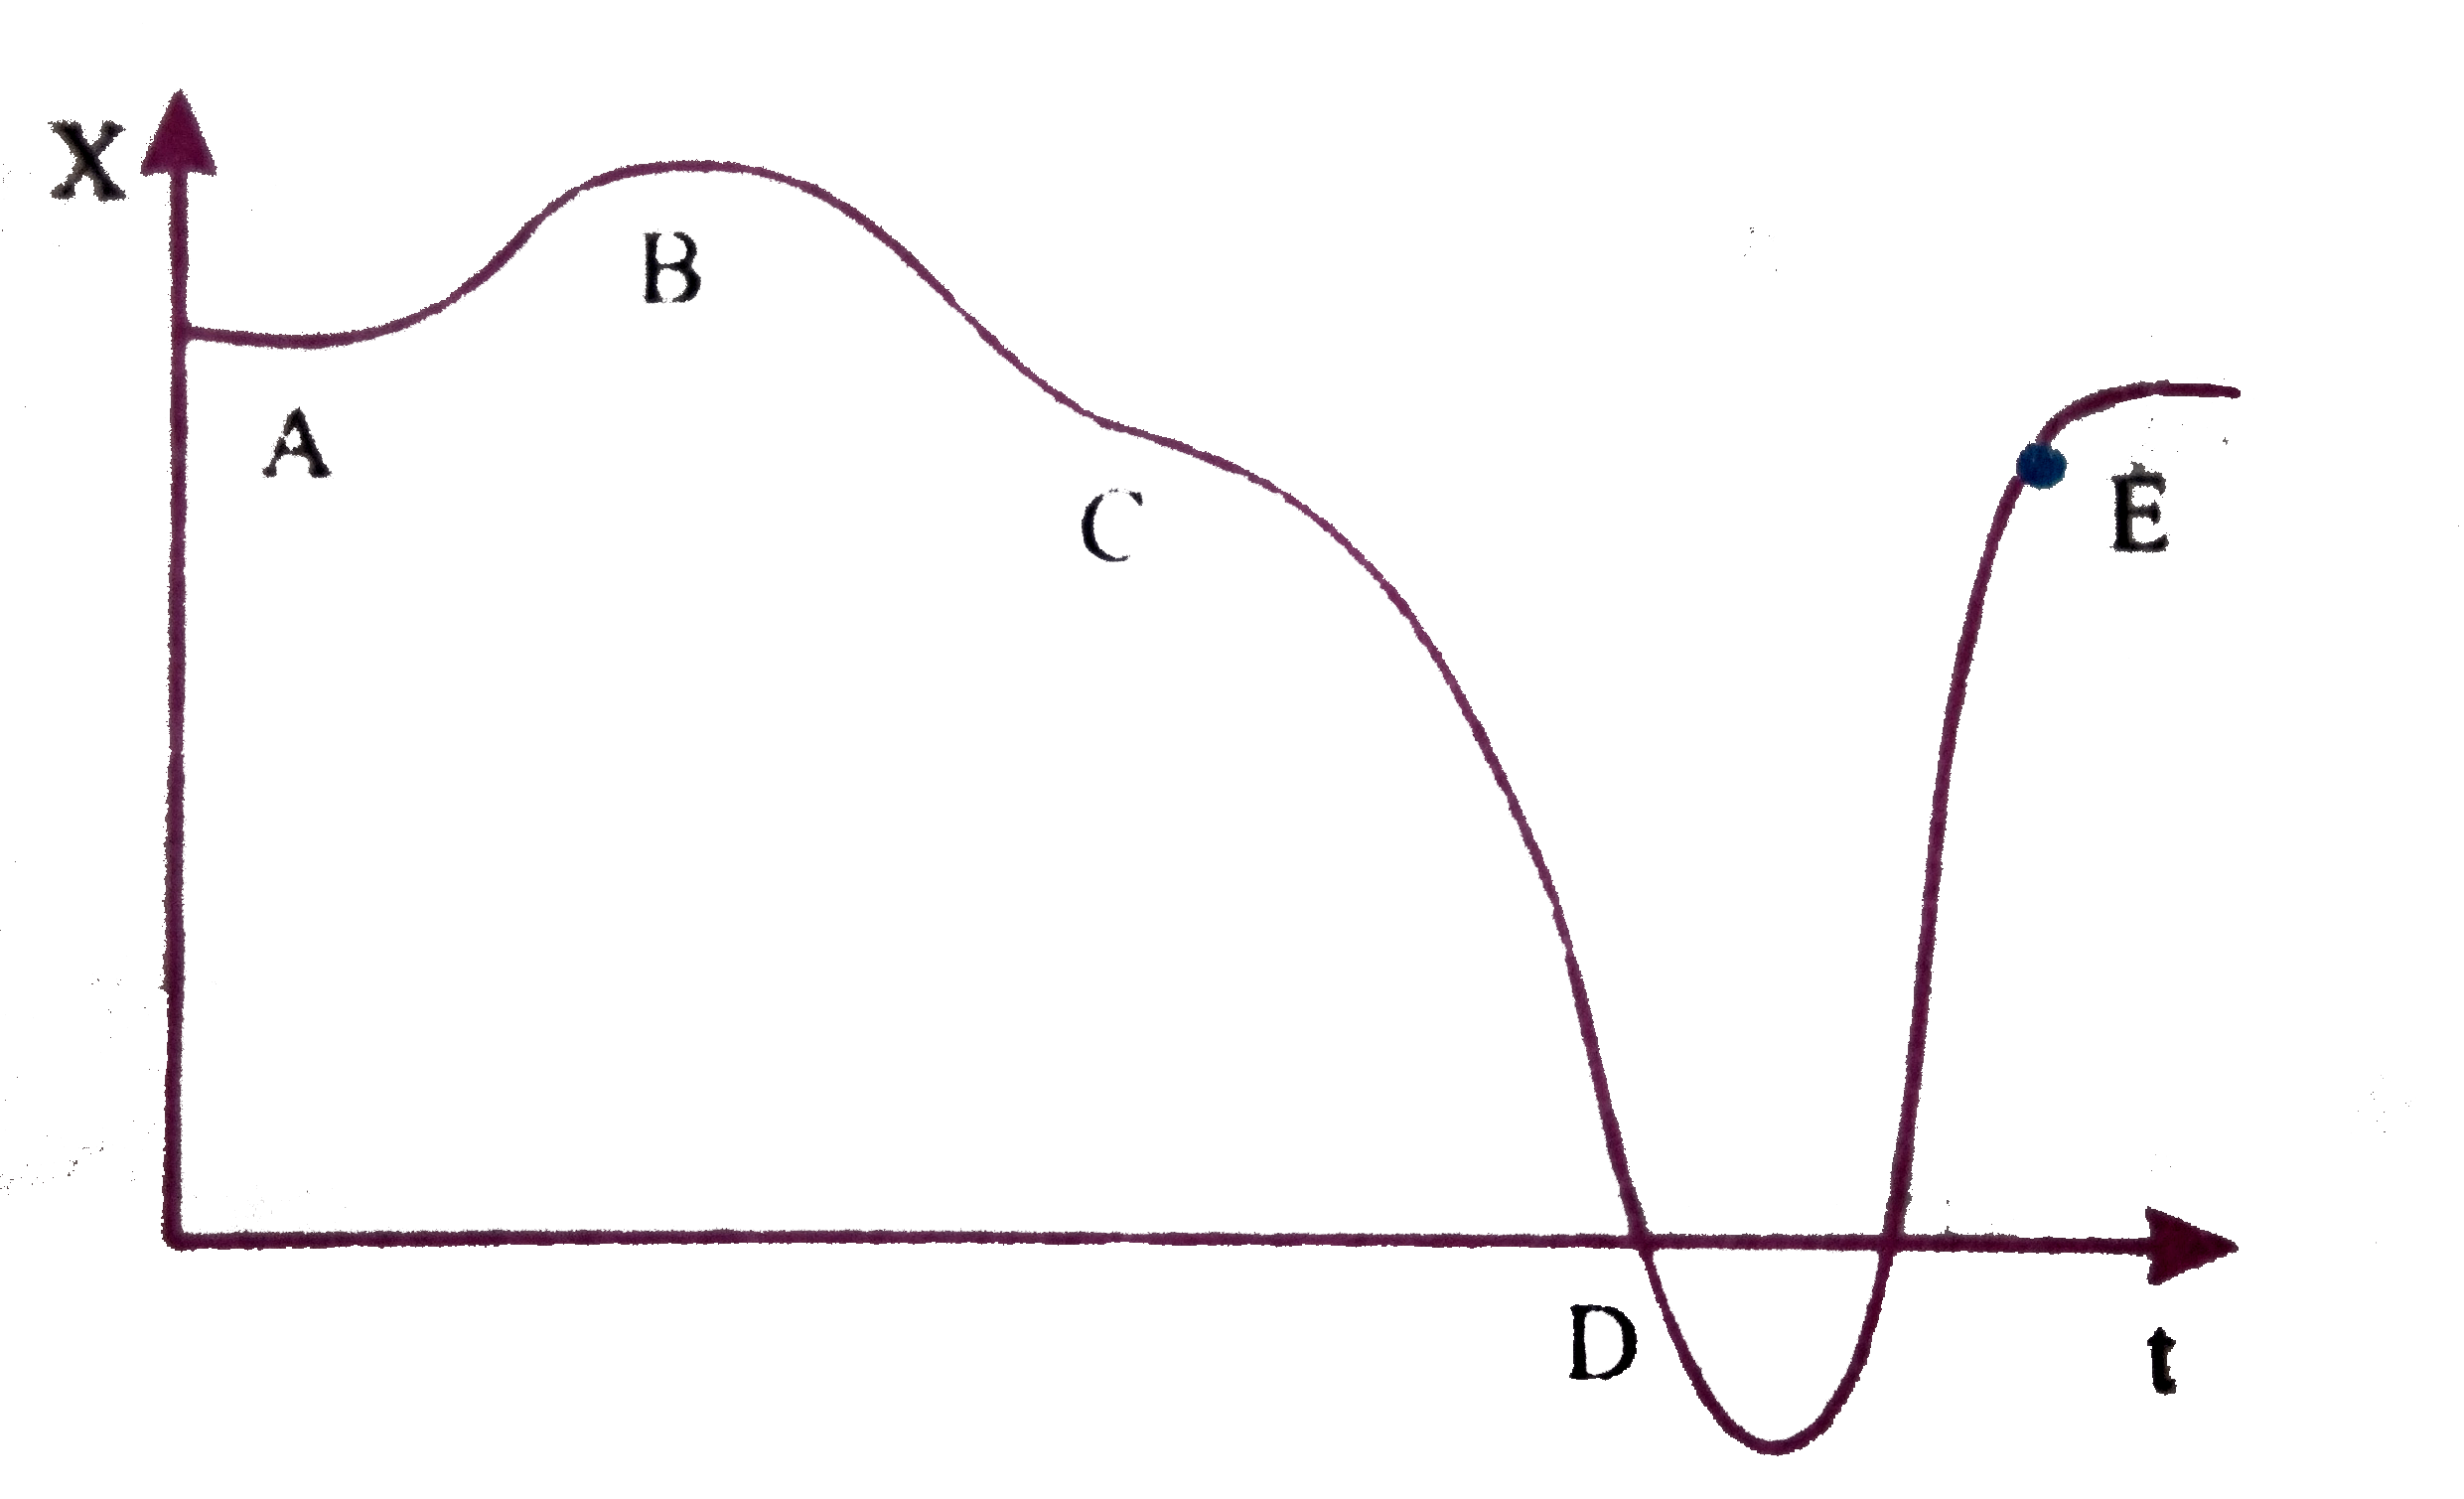
A graph of x versus t is shown in figure. Choose correct alternative from below.
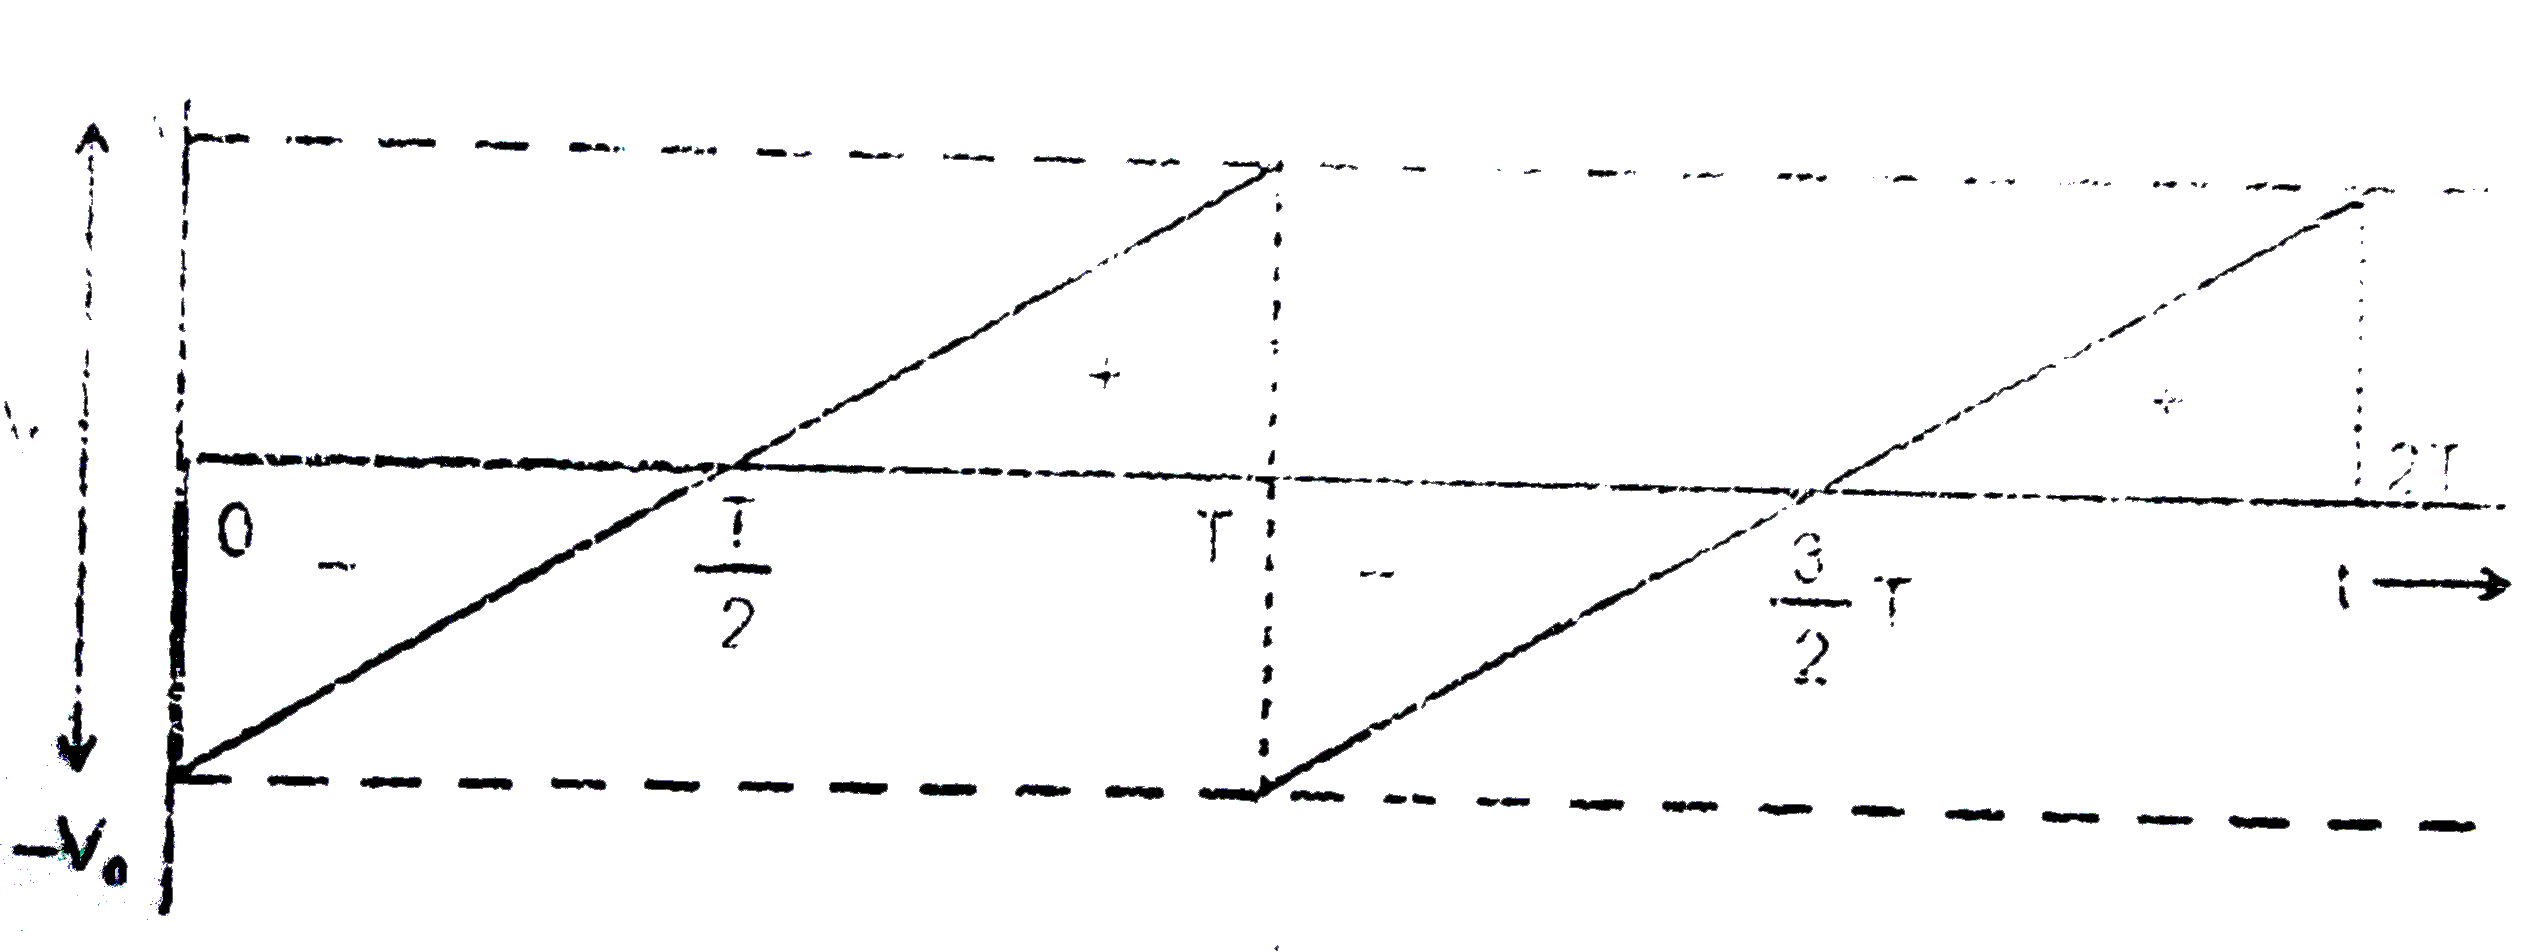
View SolutionThe rms value of the saw-tooth voltage of peak value V0 from t=0 to t=2T as shown in figure is V0√x.Find the value of x.
View SolutionWhile determining the value of g using simple pendulum, we plot a graph between l and T2 which is
View SolutionThe graph between the (velocity2) and temperature T of a gas is
View SolutionWhen a plot between logk and 1/T is plotted we get the graph as shown.
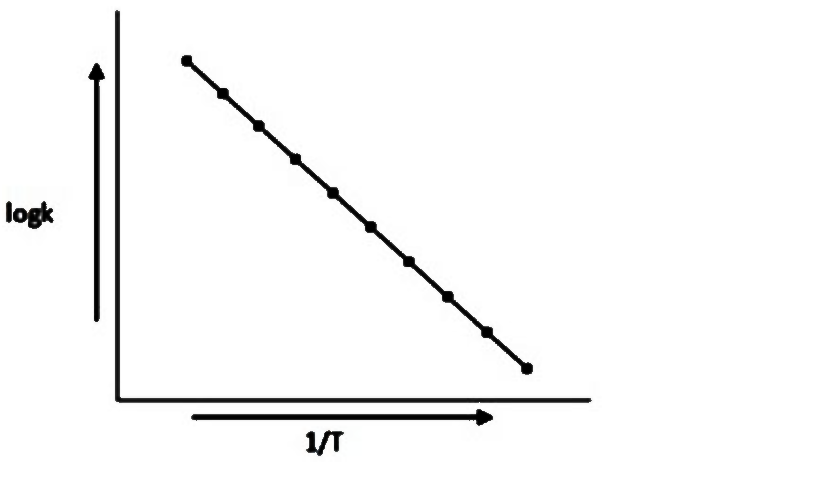
What is the value of slope in the graph?
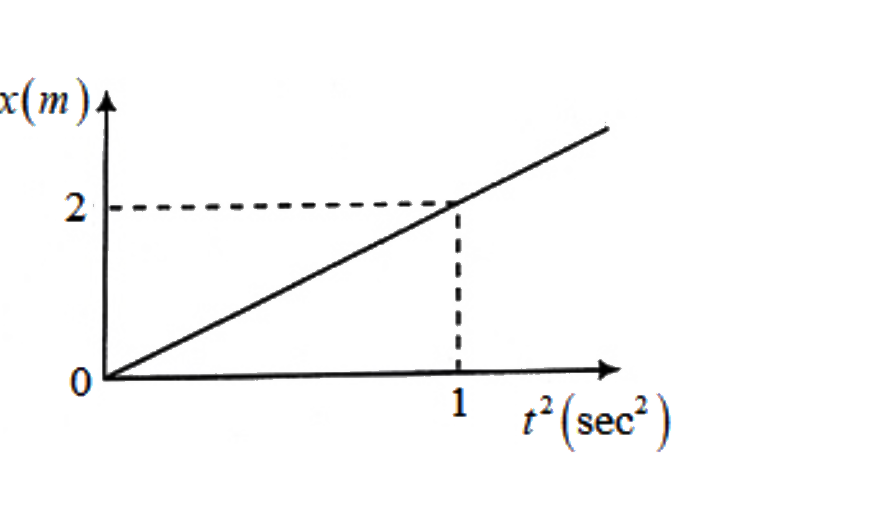
View SolutionDisplacement x versus t2 graph is shown for a particle. The acceleration of particle is
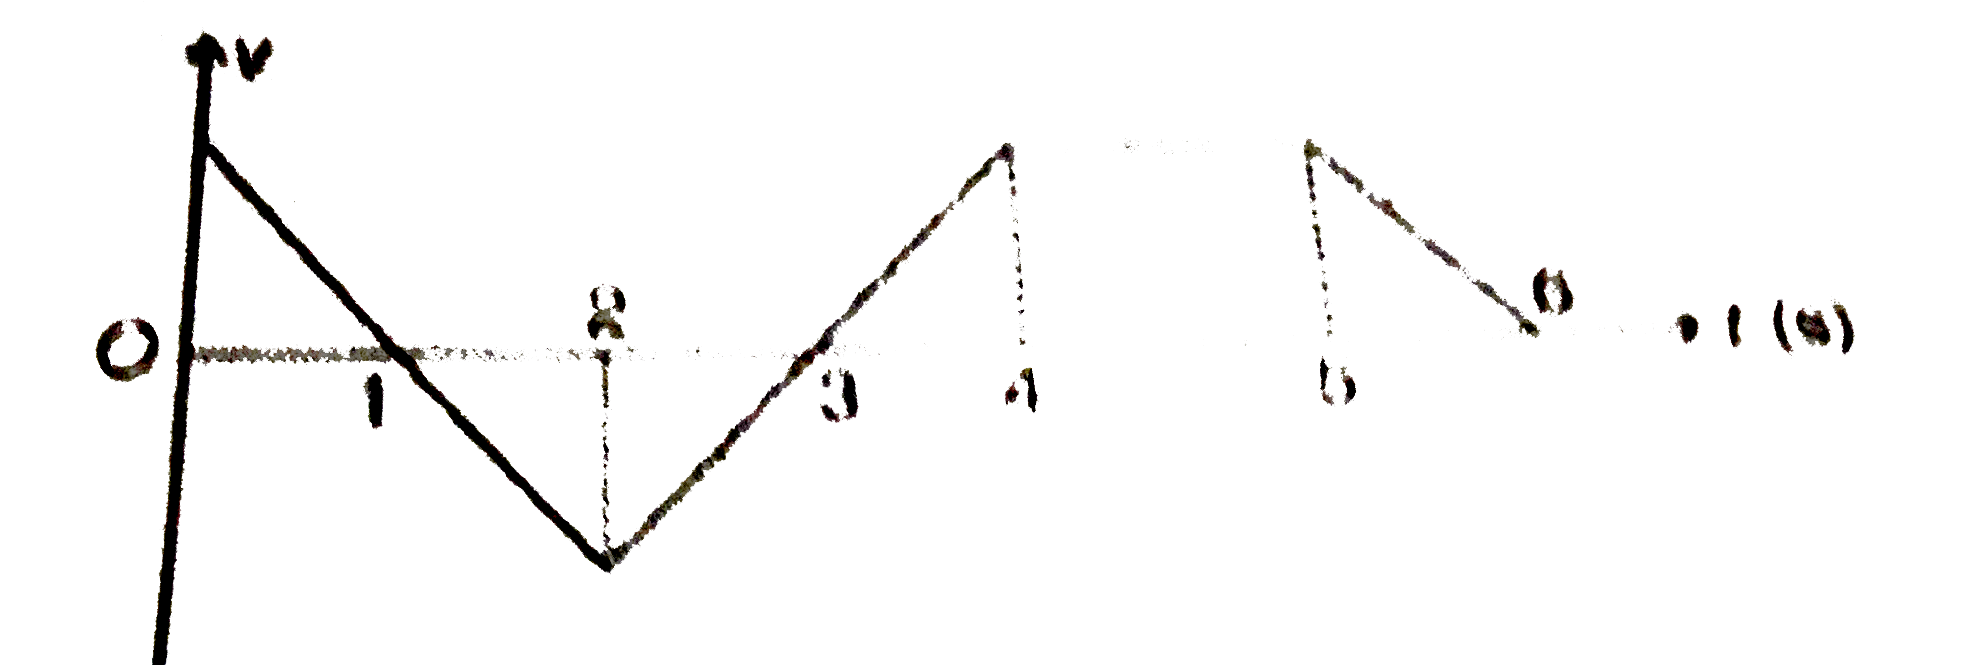
View SolutionFrom v−t graph shown in figure. We can draw the following conclusions
View SolutionThe graph of x4=x2y2 is a union of n different lines, then the value of n is.
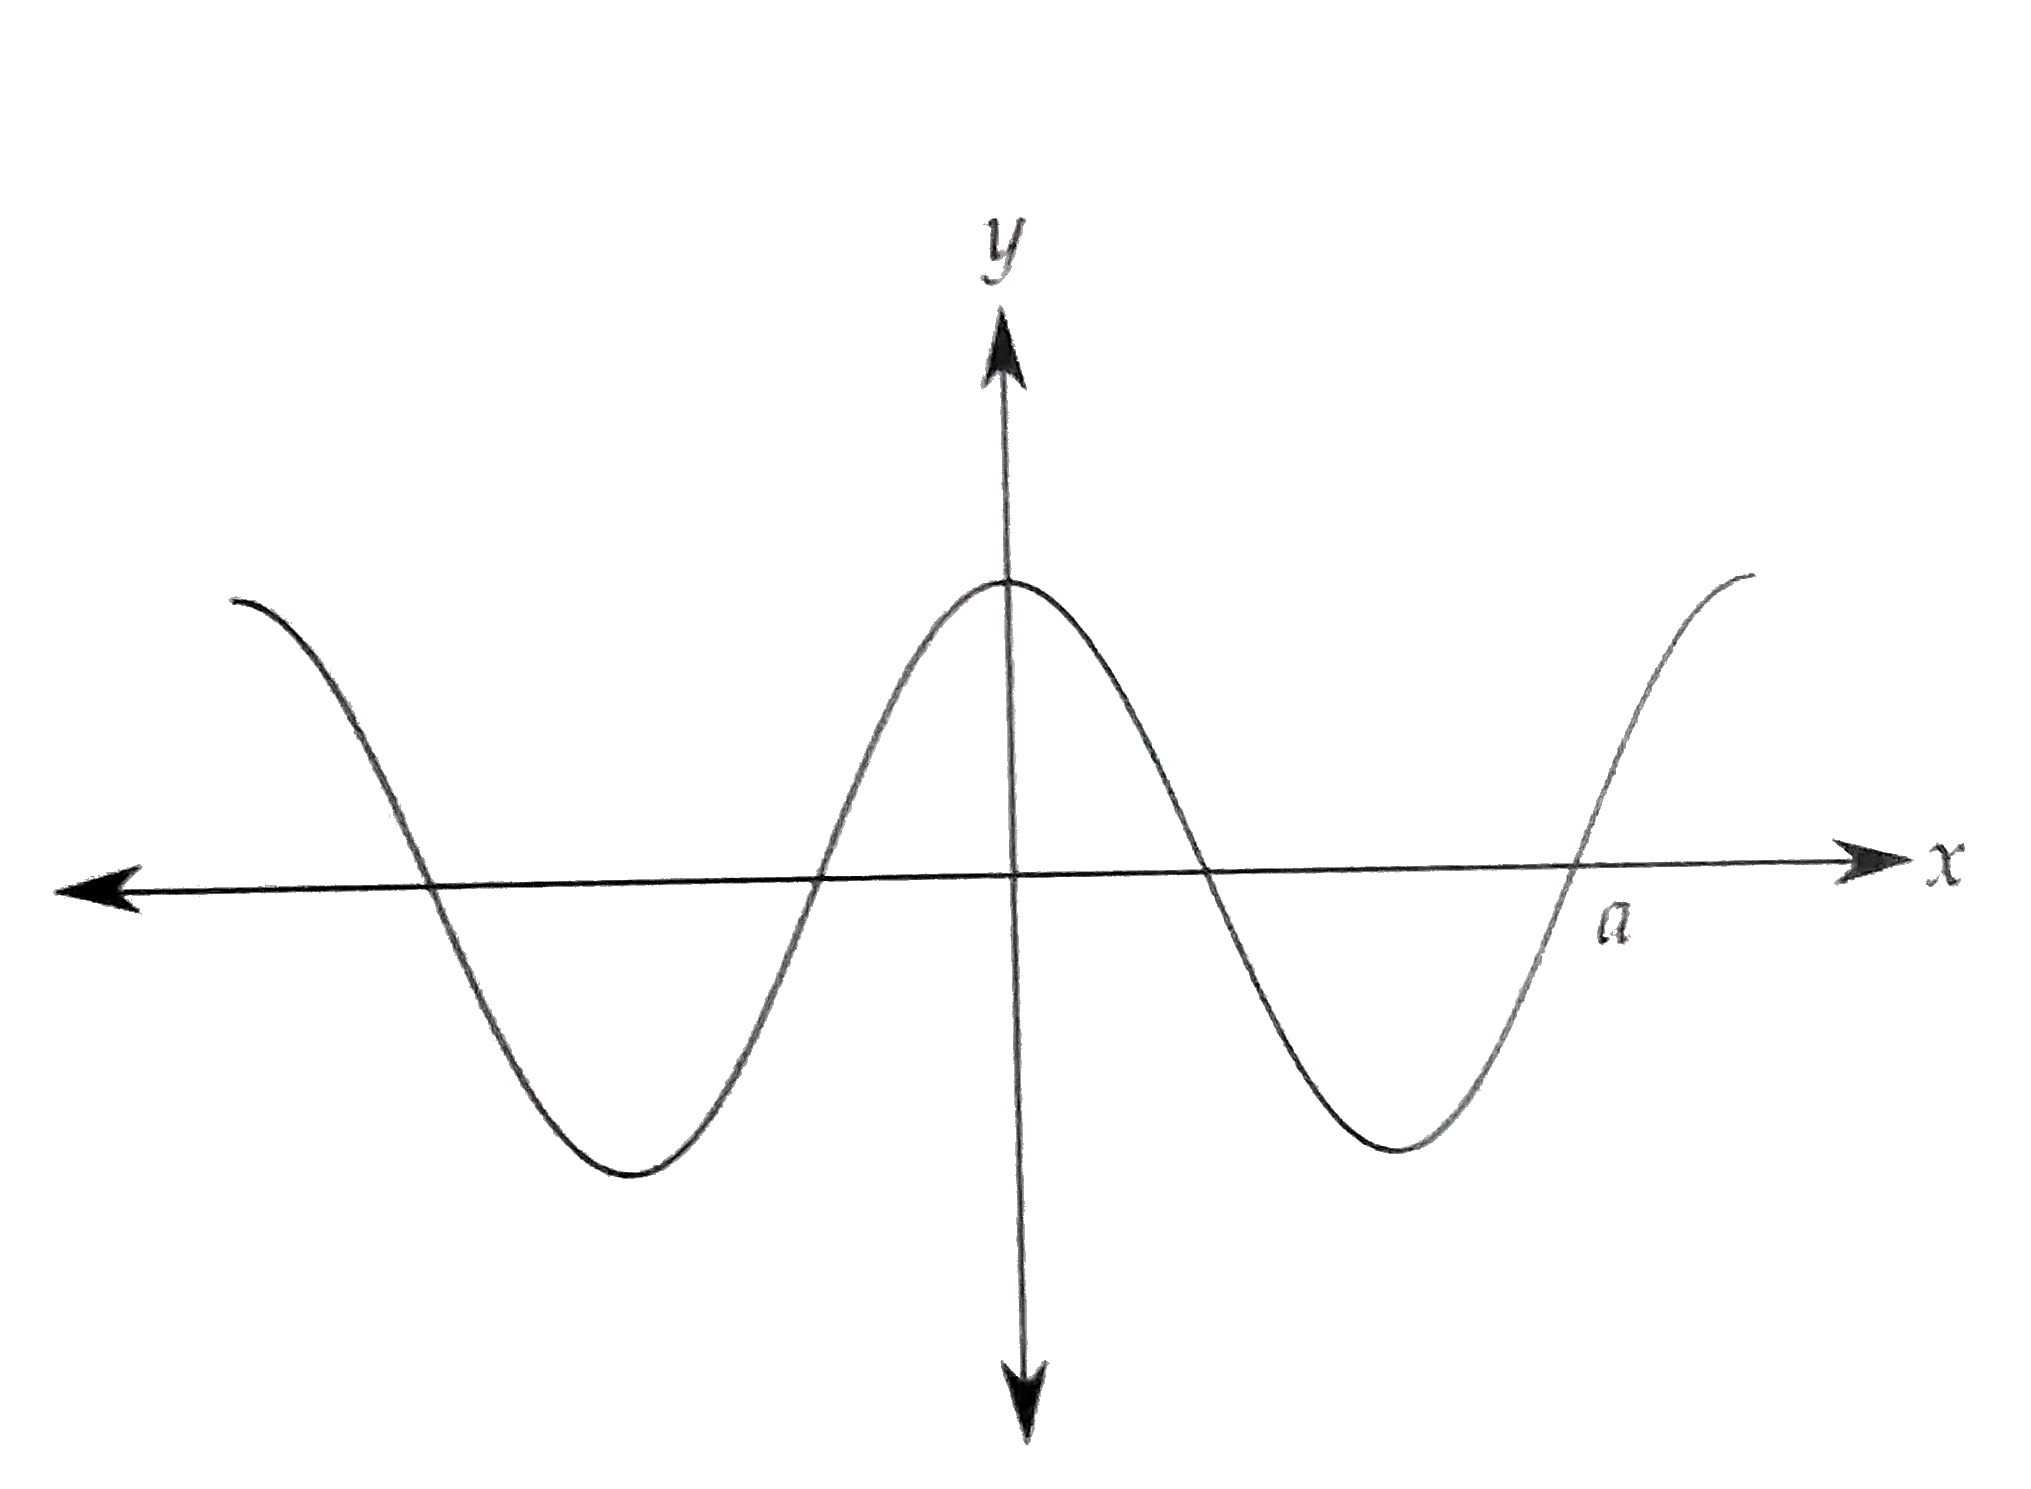
View SolutionThe graph of y=cos.x2 is shown in Figure Point a has coordinates (t, 0). What is the value of t in radians ?
View SolutionIn the given figure, l || m and p || q. Find the value of x,y,z,t.
View Solution
