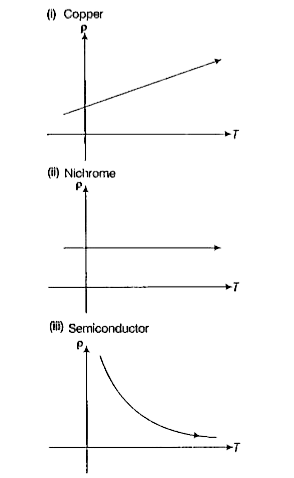
With the help of graphs, show how resistivity changes with temperature in the cases of.
(i) copper, (ii) nichrome and (iii) semiconductor.
Similar Questions
Knowledge Check
- Question 1 - Select One
which of the following graph represents the variation of resistivity (ρ) with temperature (T) for copper?
A B
B C
C D
D
How does the conductivity and resistivity change with rise of temperature in case of intrinsic semiconductor?
View SolutionDiscuss the effect of temperature on the resistance of (i) metals (ii) semiconductors and (iii) insulators.
View SolutionShow on a graph the variation of resistivity with temperature for a typical semiconductor
View SolutionShow on a graph, the variation of resistivity with temperature for a typical semiconductor.
View SolutionShow on a graph, the variation of resistivity with temperature for a typical semiconductor.
View SolutionDefine resistivity of the material. State its SI unit and discuss its variation with temperature in case of (i) metals (ii) semiconductors and (iii) insulators.
View SolutionWhich of the following graph represents the variation of resistivity (ρ) with temperature (T) for copper?
View Solution


