The rainfall (in mm) in a city of 7 days of a certain week was recorded as follows :

Find the range of the rainfall in the above data
10.5
12.5
20.5
13.5
The correct Answer is:C
Step by step video, text & image solution for The rainfall (in mm) in a city of 7 days of a certain week was recorded as follows : Find the range of the rainfall in the above data by Maths experts to help you in doubts & scoring excellent marks in Class 14 exams.
Topper's Solved these Questions
- BOOK - ARIHANT PUBLICATION PUNJABCHAPTER - DATA HANDLING EXERCISE - CHAPTER EXERCISE50videos
DATA HANDLING
- BOOK - ARIHANT PUBLICATION PUNJABCHAPTER - ALGEBRA EXERCISE - CHAPTER EXERCISE73videos
ALGEBRA
- BOOK - ARIHANT PUBLICATION PUNJABCHAPTER - DATA HANDLING AND PATTERNSEXERCISE - Chapter Exercise50videos
DATA HANDLING AND PATTERNS
Similar Questions
The rainfall (in mm) in a city on 7 days of a certain week was recorded as follows:(i) Find the range of the rainfall in the above data.(ii) Find the mean rainfall for the week.(iii) On how many days was the rainfall less than the mean rainfall.
View SolutionThe rainfall (in mm) in a city of 7 days of a certain week was recorded as follows :

Find the mean rainfall for the weekView Solution
Knowledge Check
- Question 1 - Select One
Study the given information carefully and answer the questions based on it.
The rainfall (in mm) in a city on 7 days of a certain week was recorded as follows.

Find the mean rainfall for the week.A5.9B5.0C5.5D4.5 - Question 2 - Select One
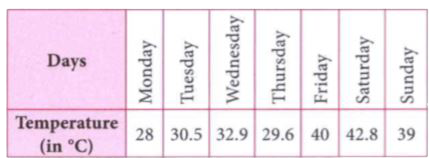
The temperature (in °C) of a city in a week was recorded as follows :

What is the range of the temperature?A20.8∘CB28.6∘CC14.8∘CD32.9∘C
The rainfall (in mm) in a city on 7 days of a certain week was recorded as follows: (i) Find the range of the rainfall in the above data. (ii) Find the mean rainfall for the week. (iii) On how many days was the rainfall less than the mean rainfal
View SolutionFind semi-inter quartile range of the following data :
 View Solution
The tatste of 500 people of a sociaety for different type of food was recorded as follows :

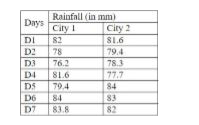
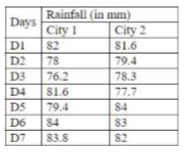
Draw a pie diagram to represent the above data.View SolutionThe Table given below presents the Rainfall (in mm) in two cities on different of a week.
The rainfall on day D2 in city 1 is how much percent more than the rainfall on day D4 in City 2?
 View Solution
The rainfall recorded in a city for 60 days is given in the following table

Calulate the median rainfall using a more than type ogive.View SolutionThe Table given below presents the Rainfall (in mm) in two cities on different days of a week.
What is the difference (correct up to two decimal places) in average rainfall in two cities per day?
 View Solution

