For which of the following would you use a histogram to show the data?
A
The number of letters for different areas in a postman's bag
B
The height of competitors in an athletics meet
C
The number of cassettes produced by 5 companies
D
The number of passengers boarding trains from 7:00 am to 7:00 pm at a station
Text Solution
The correct Answer is:C
|
Topper's Solved these Questions
- DATA HANDLING BOOK - ARIHANT PUBLICATION PUNJABCHAPTER - DATA HANDLING EXERCISE - CHAPTER EXERCISE
50 Videos
- ALGEBRA BOOK - ARIHANT PUBLICATION PUNJABCHAPTER - ALGEBRA EXERCISE - CHAPTER EXERCISE
73 Videos
- DATA HANDLING AND PATTERNSBOOK - ARIHANT PUBLICATION PUNJABCHAPTER - DATA HANDLING AND PATTERNSEXERCISE - Chapter Exercise
50 Videos
Similar Questions
Knowledge Check
Which of the following solutions would you use test the pH of a given sample?
ABlue litmus solutionBRed litmus solutionCUniversal indicator solutionDA mixture of blue and red litmus solutions
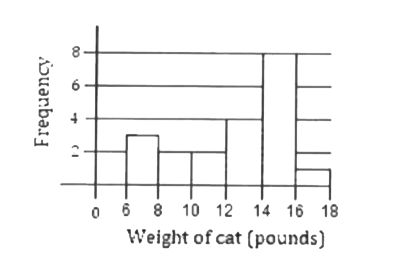
The histogram above shows the distribution of the weights, in pounds, of 18 cats in a shelter. Which of the following could be the median weight of the 18 cats represents in the histogram?A10 poundsB11 poundsC13.5 poundsD16 poundsWhich of the following solutions would you use test the pH of a given sample?
Ablue litmus solutionBred litmus solutionCuniversal indicator solutionDmixture of red and blue litmus solution
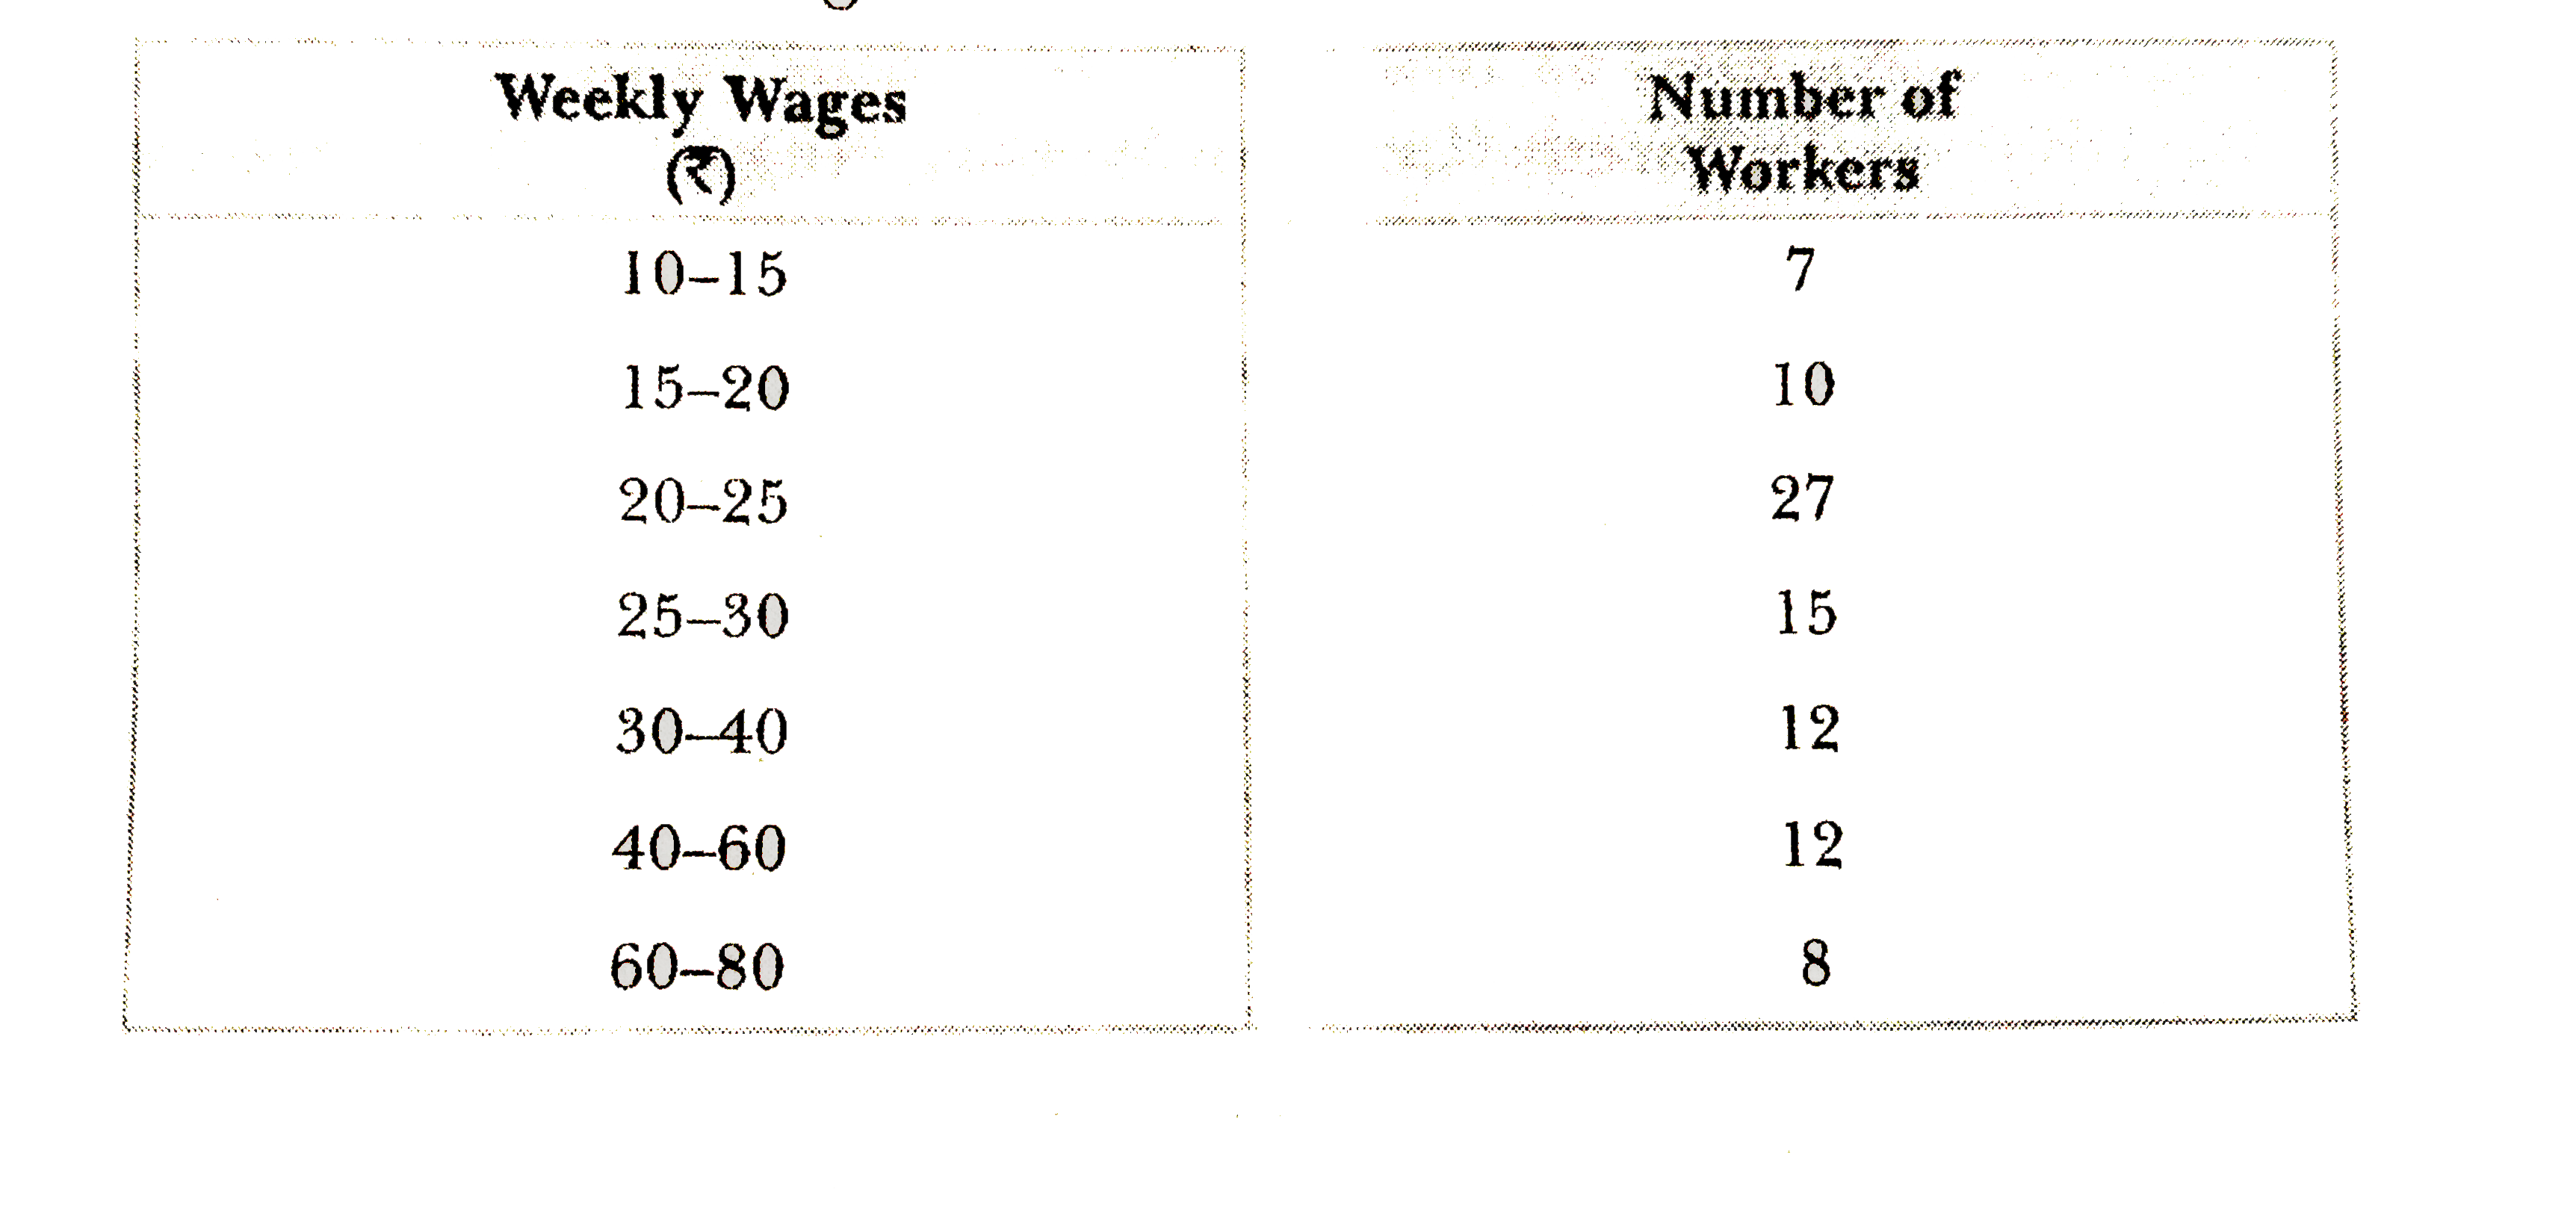
Represent the following data using a histogram.

View SolutionFind the mode of following data, using a histogram.

View SolutionPresent the following data in the form of a histogram :

View SolutionPresent the following data in the form of a histogram :

View SolutionDraw a histogram of the following data

View Solution

