The temperature of a particular place is continuously decreasing, Which of the following graphs shows the condition?


The correct Answer is:D
To solve the question regarding which graph depicts a continuously decreasing temperature, we will analyze each option step by step.
Step 1: Understand the Question
The question states that the temperature of a particular place is continuously decreasing over time. This means that as time progresses, the temperature should show a downward trend.
Hint: Look for a graph where the temperature decreases as time increases.
Step 2: Analyze Option 1
In Option 1, the graph shows that as time increases (on the x-axis), the temperature also increases (on the y-axis). This contradicts the condition of continuously decreasing temperature.
Hint: If the temperature is rising as time goes on, it cannot represent a decrease.
Step 3: Analyze Option 2
In Option 2, similar to Option 1, the graph shows that as time increases, the temperature also increases. Again, this does not satisfy the condition of a decreasing temperature.
Hint: Look for a downward slope; if it’s upward, it’s not the right option.
Step 4: Analyze Option 3
In Option 3, the graph again indicates that as time increases, the temperature is increasing. This option also does not depict a decreasing trend.
Hint: Check if the graph slopes downwards; if it doesn’t, it’s not the correct choice.
Step 5: Analyze Option 4
In Option 4, the graph shows that as time increases, the temperature starts at a high point and then decreases. This clearly represents the condition of continuously decreasing temperature.
Hint: A downward slope over time indicates a decrease in temperature.
Conclusion
After analyzing all four options, we can conclude that Option 4 is the correct answer, as it depicts a continuously decreasing temperature over time.
Final Answer: Option 4 is the graph that shows the condition of continuously decreasing temperature.
The question states that the temperature of a particular place is continuously decreasing over time. This means that as time progresses, the temperature should show a downward trend.
In Option 1, the graph shows that as time increases (on the x-axis), the temperature also increases (on the y-axis). This contradicts the condition of continuously decreasing temperature.
In Option 2, similar to Option 1, the graph shows that as time increases, the temperature also increases. Again, this does not satisfy the condition of a decreasing temperature.
In Option 3, the graph again indicates that as time increases, the temperature is increasing. This option also does not depict a decreasing trend.
In Option 4, the graph shows that as time increases, the temperature starts at a high point and then decreases. This clearly represents the condition of continuously decreasing temperature.
After analyzing all four options, we can conclude that Option 4 is the correct answer, as it depicts a continuously decreasing temperature over time.
Topper's Solved these Questions
- BOOK - ARIHANT PUBLICATION PUNJABCHAPTER - DATA HANDLING EXERCISE - CHAPTER EXERCISE50videos
DATA HANDLING
- BOOK - ARIHANT PUBLICATION PUNJABCHAPTER - ALGEBRA EXERCISE - CHAPTER EXERCISE73videos
ALGEBRA
- BOOK - ARIHANT PUBLICATION PUNJABCHAPTER - DATA HANDLING AND PATTERNSEXERCISE - Chapter Exercise50videos
DATA HANDLING AND PATTERNS
Similar Questions
Knowledge Check
- Question 1 - Select One
The following graph shows the
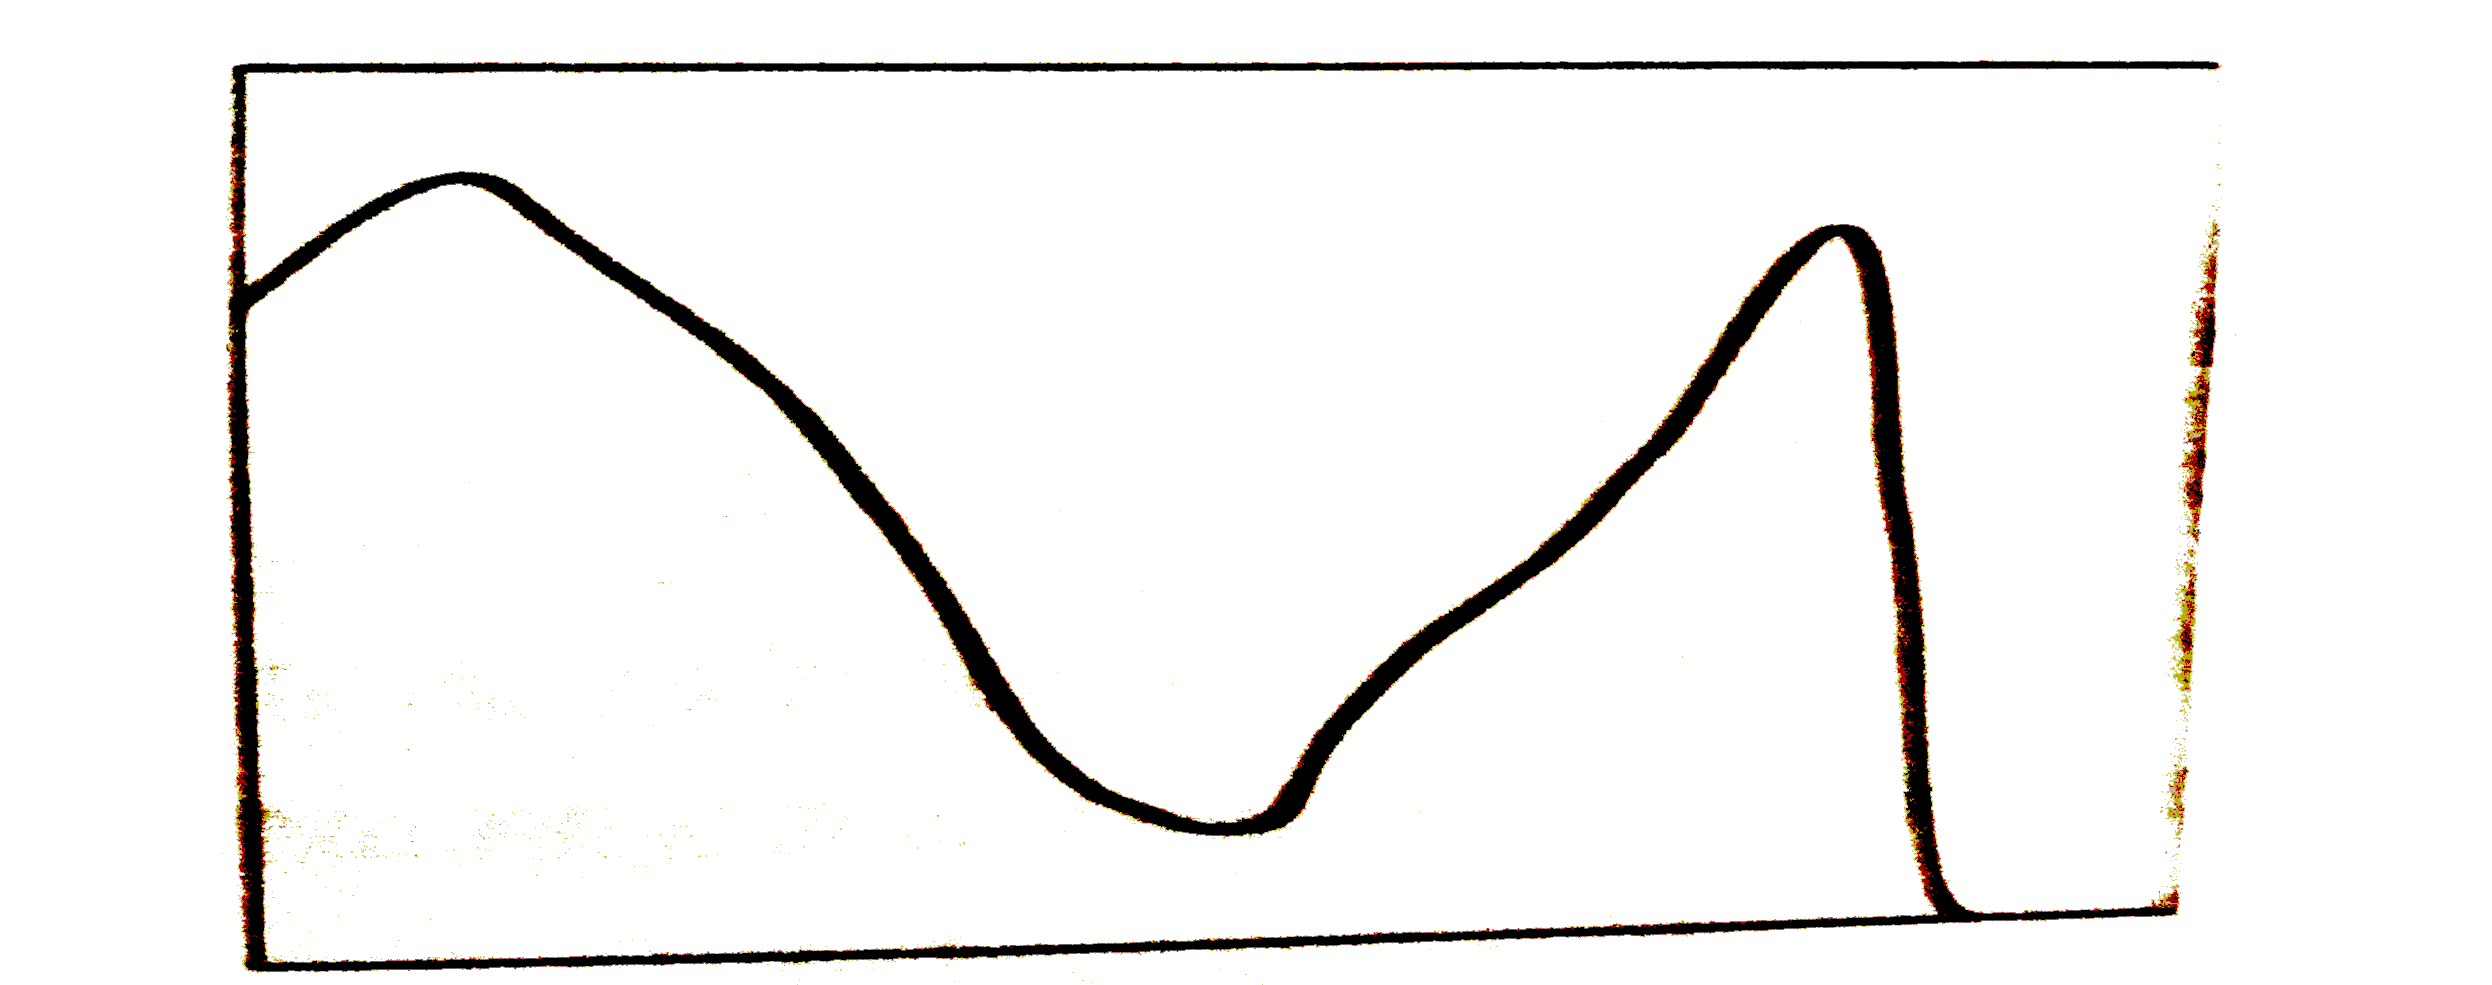 AAbsorption spectrum of chlorophyll aBAbsorption spectrum of chlorophyll bCAction spectrum of photosynthesisDBoth A and B
 - Question 2 - Select One
These days, prices are falling. Which of the following graphs shows this conditions?
A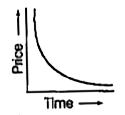 B
B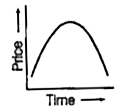 C
C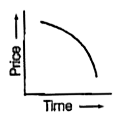 D
D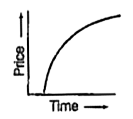
- Question 3 - Select One
The following graph show that the reaction is:
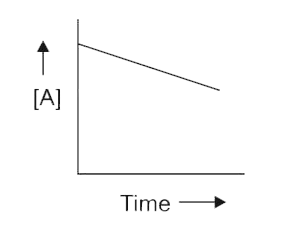 Azero orderBfirst orderCsecond orderDfractional order
Which of the following set of organisms shows dioecious conditions ?
View SolutionWhich of the following graphs has a positive , decreasing slope ?
View SolutionWhich of the following conditions shows the polluted enviorment ?
View SolutionThe following graph shows the speed ofabody which is :
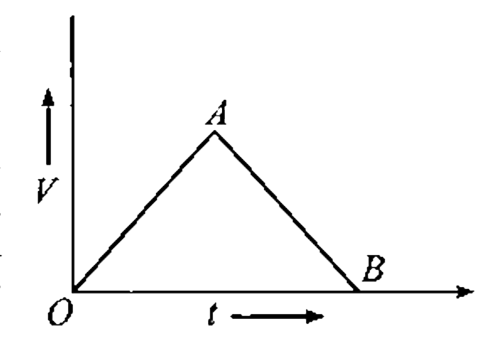 View Solution
Which of the following condition show polluted environment ?
View Solution

