Study the following graph carefully and answer the questions given below it :-
Number of people working in various departments of two different organisation:
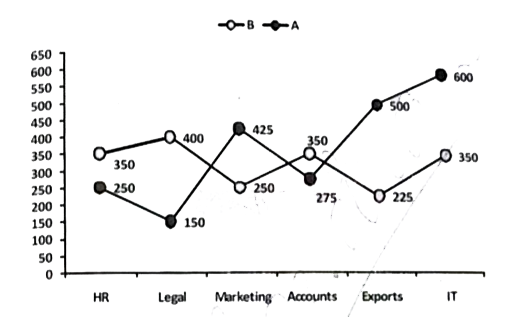
If there is 25% increase in the existing number of people in the export department of organisation A, what will be the total number of people working in the exports department of both the organisation together ?
750
850
825
900
The correct Answer is:B
Step by step video, text & image solution for Study the following graph carefully and answer the questions given below it :- Number of people working in various departments of two different organisation: If there is 25% increase in the existing number of people in the export department of organisation A, what will be the total number of people working in the exports department of both the organisation together ? by Maths experts to help you in doubts & scoring excellent marks in Class 14 exams.
Topper's Solved these Questions
Similar Questions
Study the following graph carefully and answer the question given below-
Amount of Rice, Wheat and Sugar Consumed by various restaurants over a years.
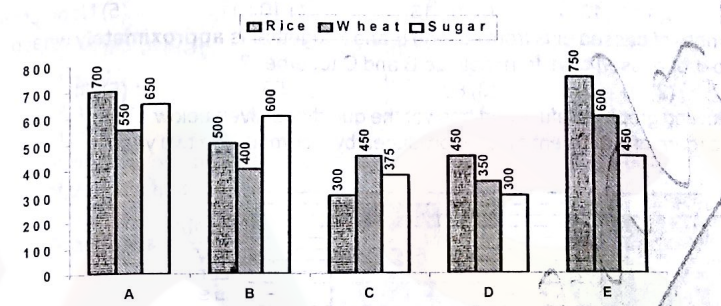
What is the respective ratio of the amount of Rice, Wheat and Sugar consumed by restaurant D to the same consumed by restaurant B ?02:05View SolutionIn one hour,a boat goes 11 km along the stream and 5 km against the stream. Then speed of the boat in still water (in km/hr) is :
02:11View SolutionThe total of the present ages of A,B,C and D is 96 years. What is B's present age ?
(i) The average age of A, B and D is 20 years.
(ii) The average age of C and D is 25 years.05:41View SolutionIn a company of 150 people, 25 people work in technical department, 55 people work in HR department and the rest work in maintenance department. Find the ratio of people working in HR department to people working in maintenance department.
02:10View SolutionDetermine the point of symmetry of a regular hexagon.
02:17View SolutionMatch the following Column A to Column B
 02:10View Solution
The inequation represented by the graph given below is :
02:03View SolutionThe inequation that best describes the graph given below is _________
02:42View SolutionThe inequation that best describes the following graph is _________
02:42View SolutionBreakup of number of employes working in different departments of an organisation, the number of males and the number of employees who recently got promoted.
Total number of employees =3,600
Employees working in different departments

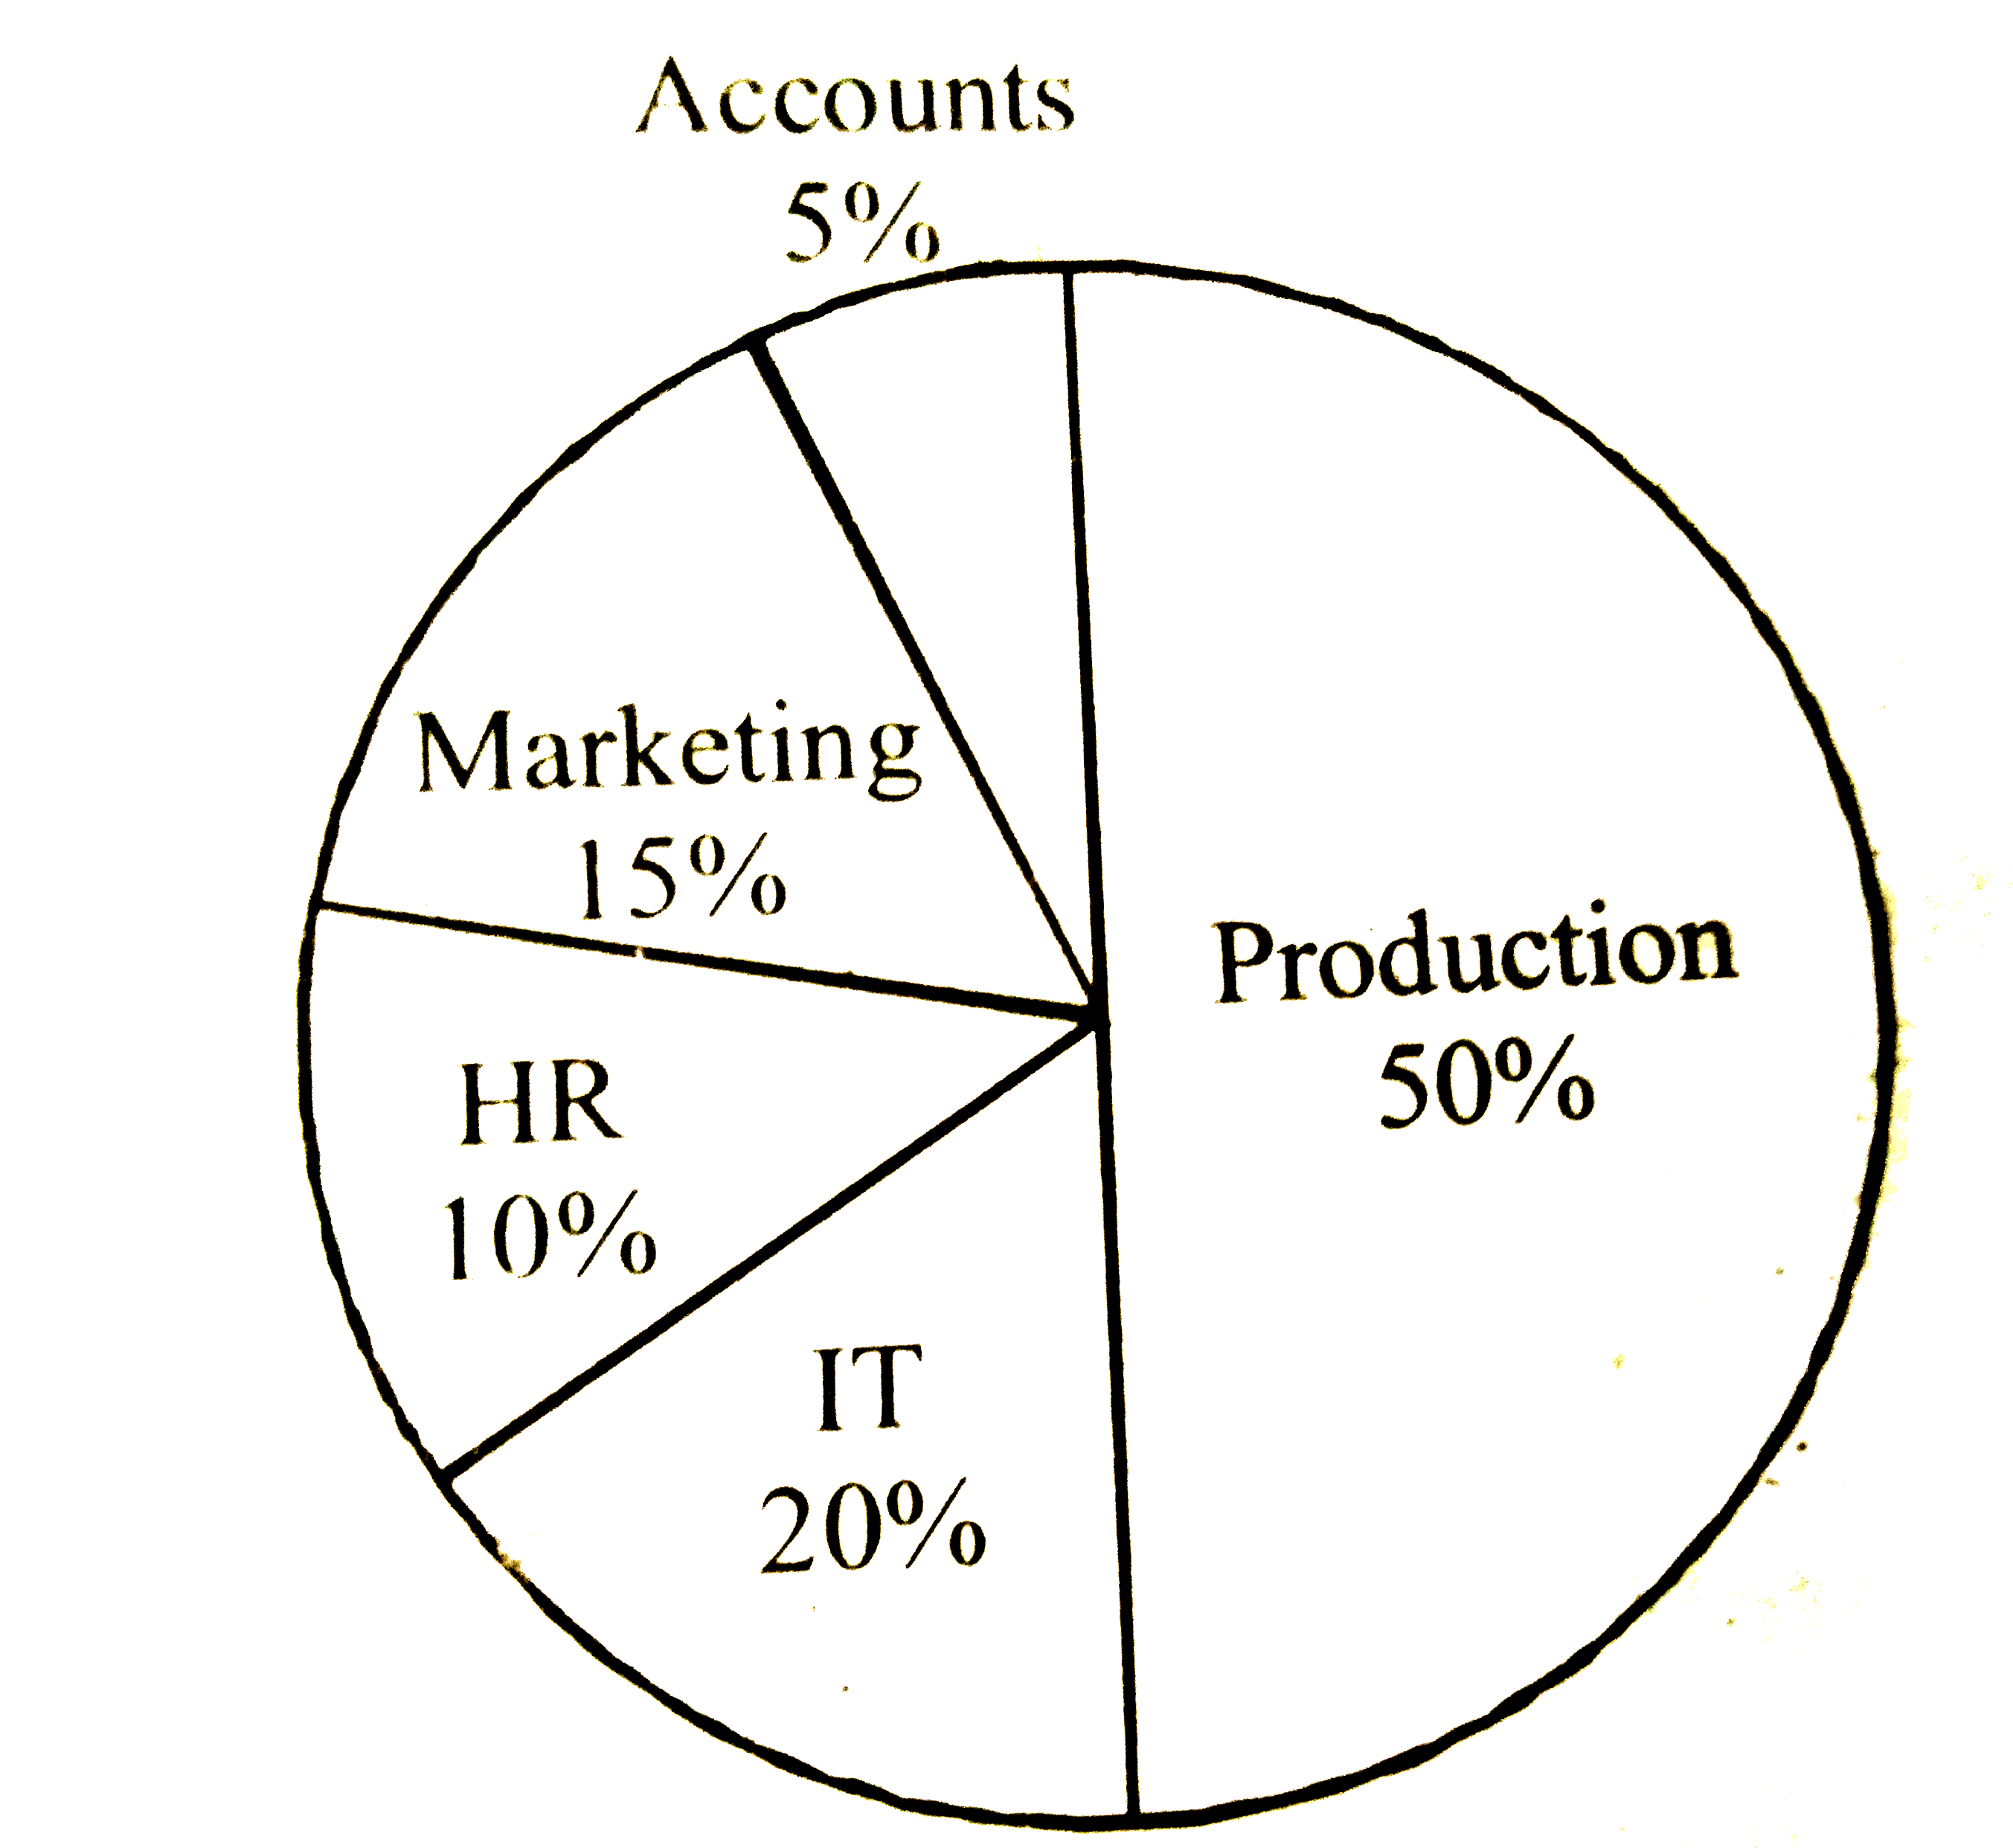
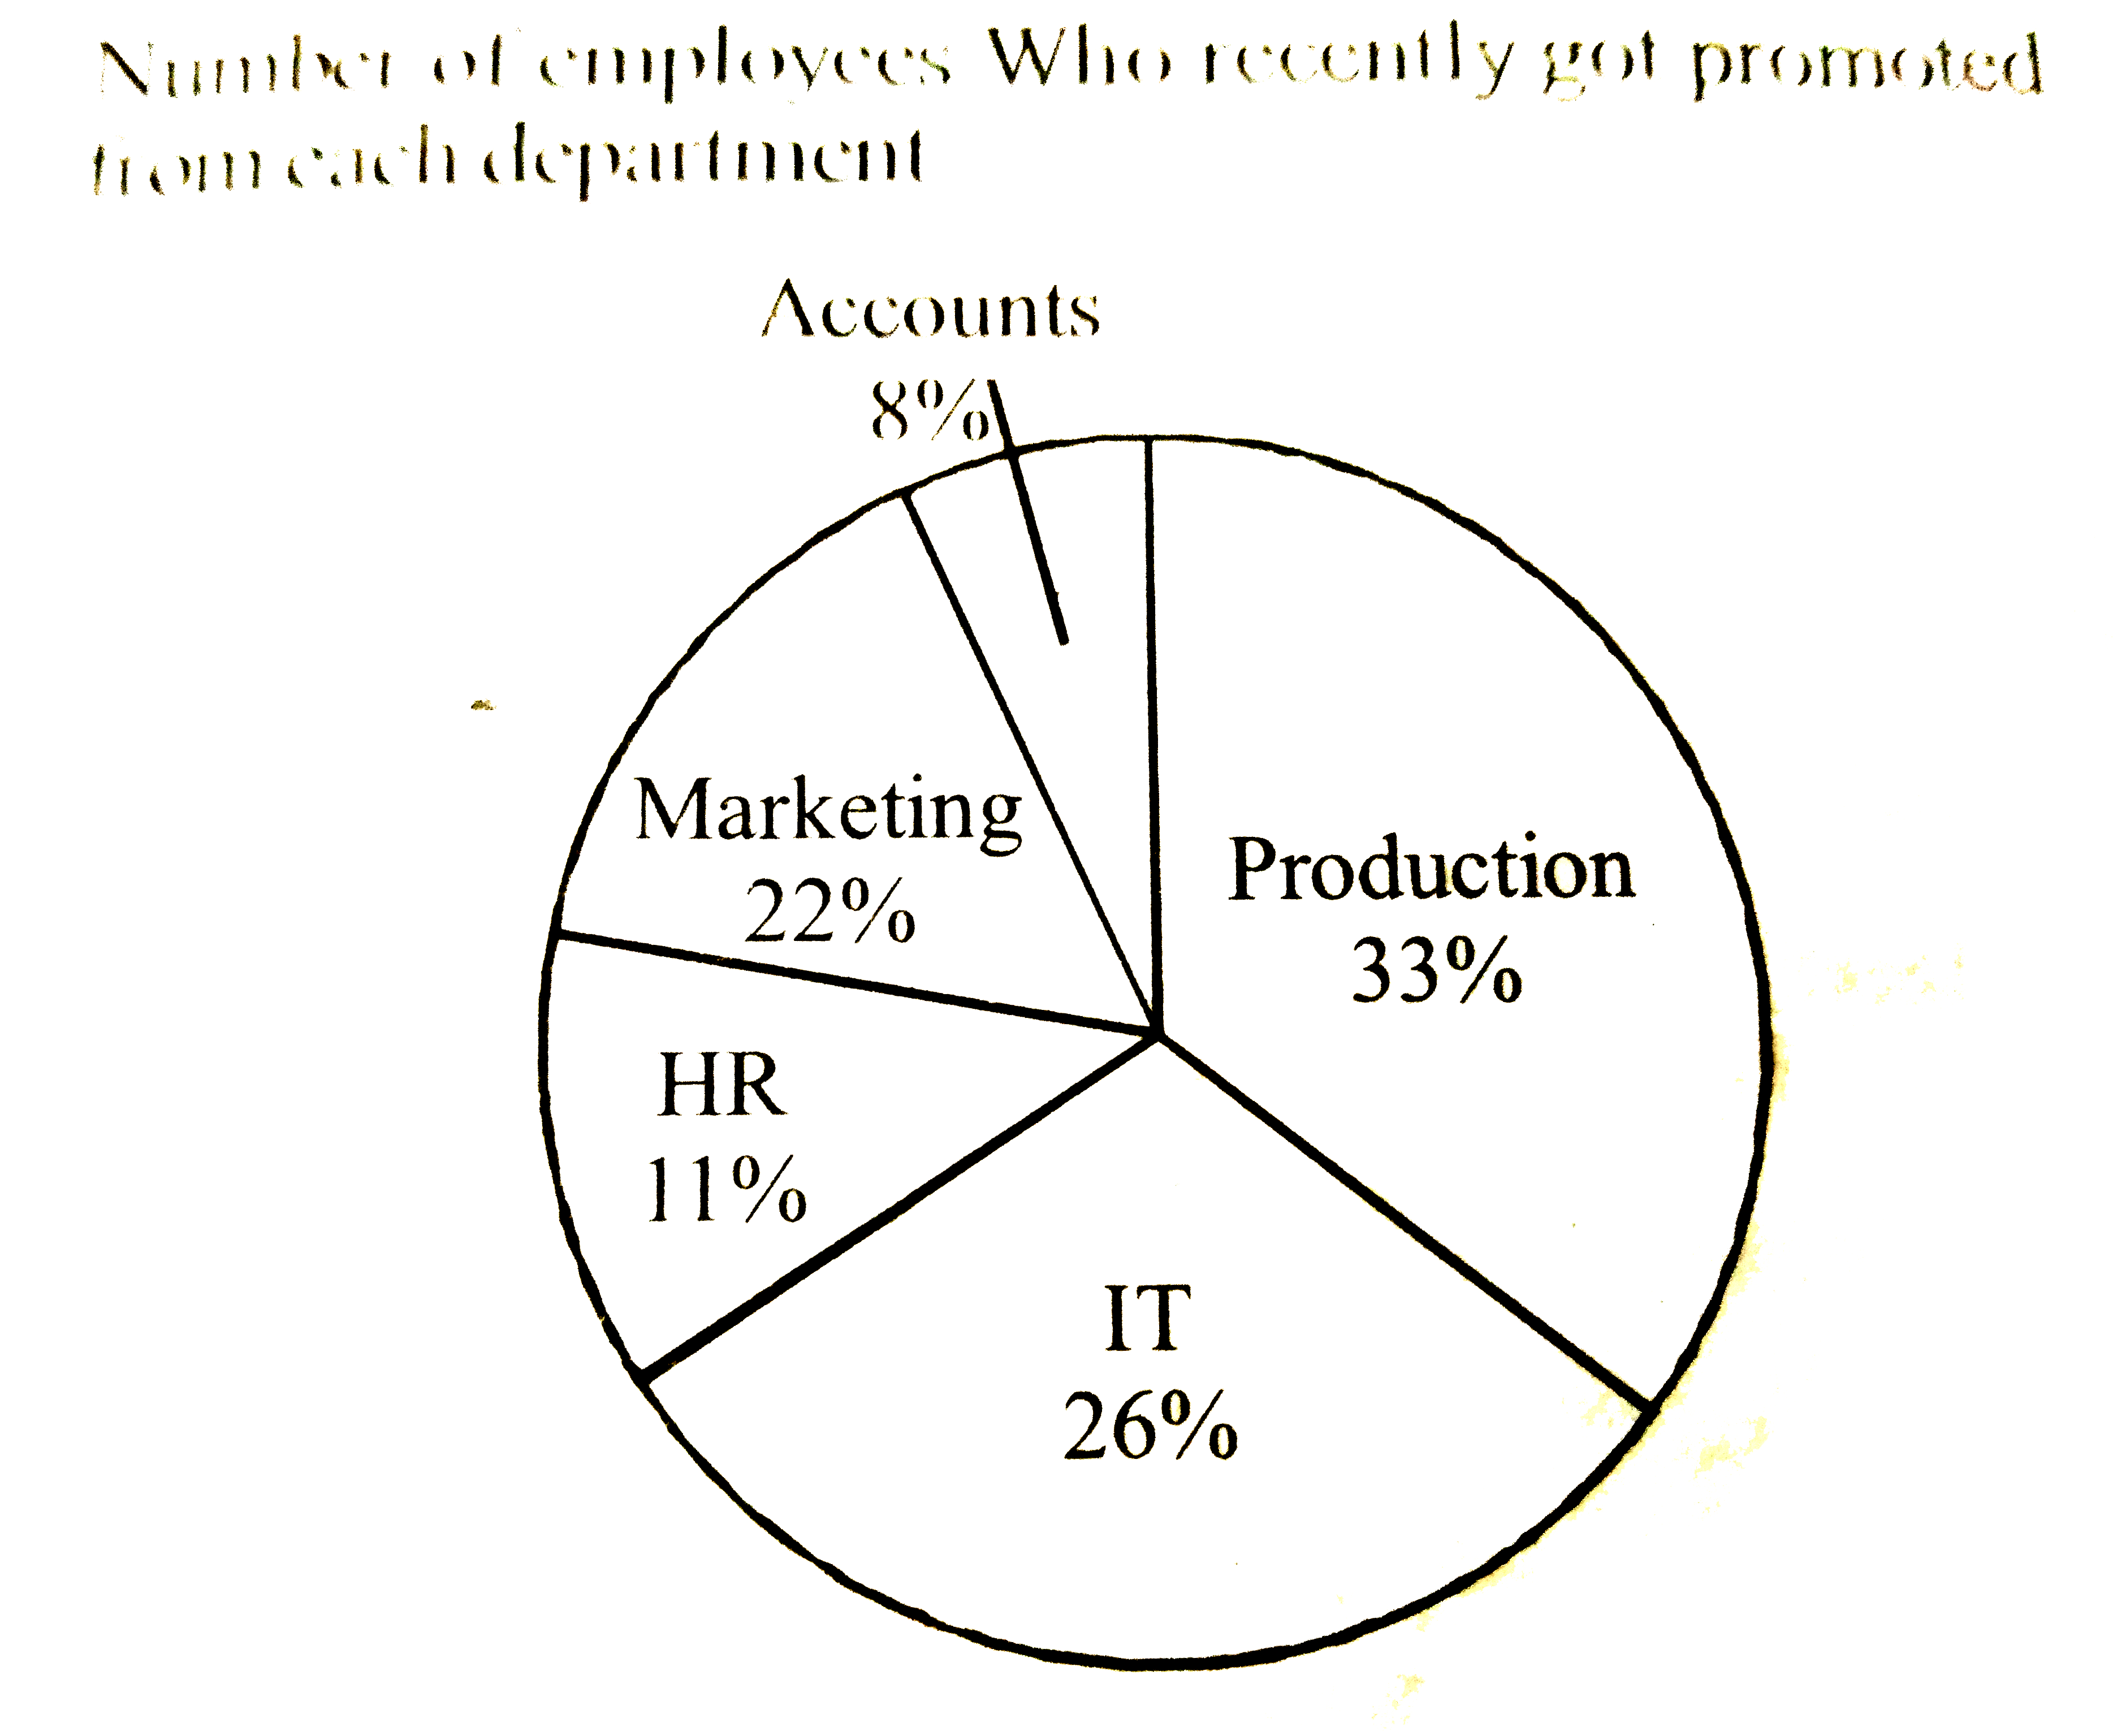
What is the total number of females working in the production and Marketing departments together ?02:35View Solution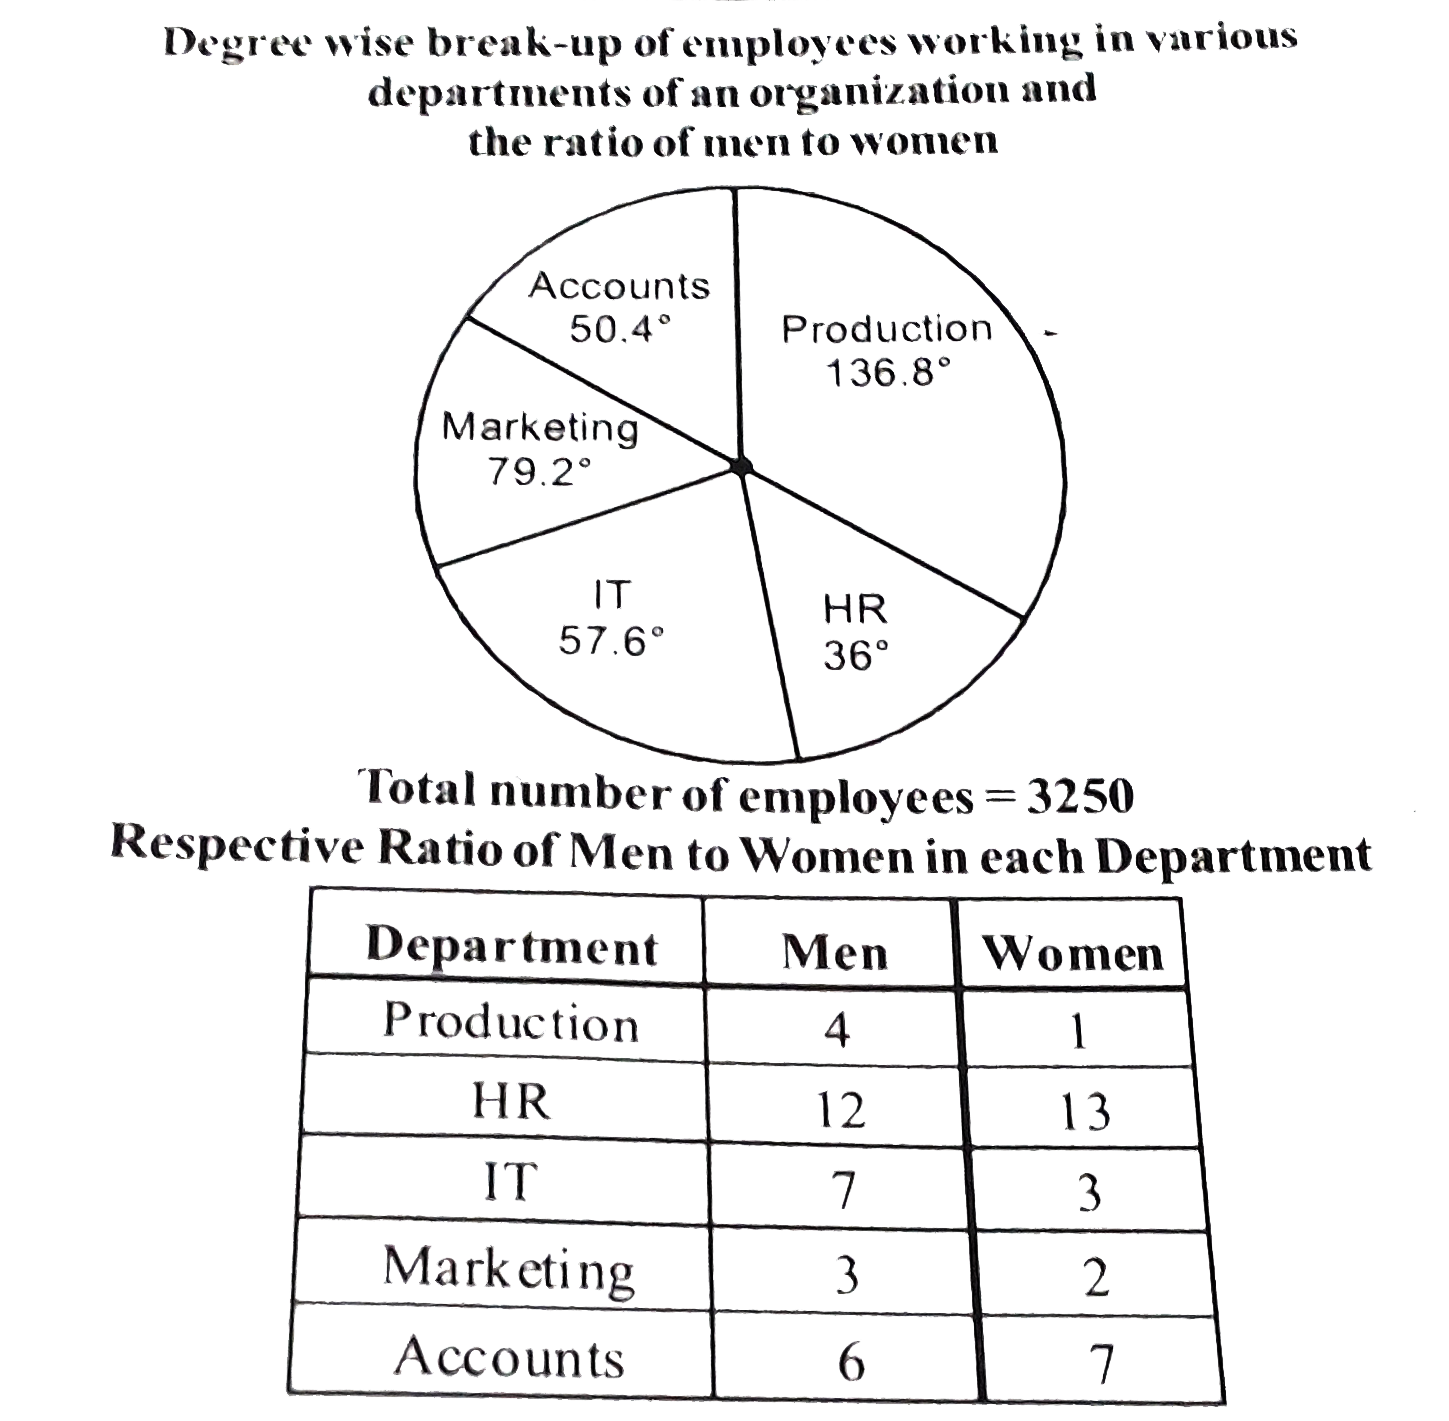
The number of men working in the production department of the organisation forms what per cent of the total number of employees working in that department ?05:30View Solution
The number of men working in the production department of the organisation forms what per cent of the total number of employees working in that department ?01:15View Solution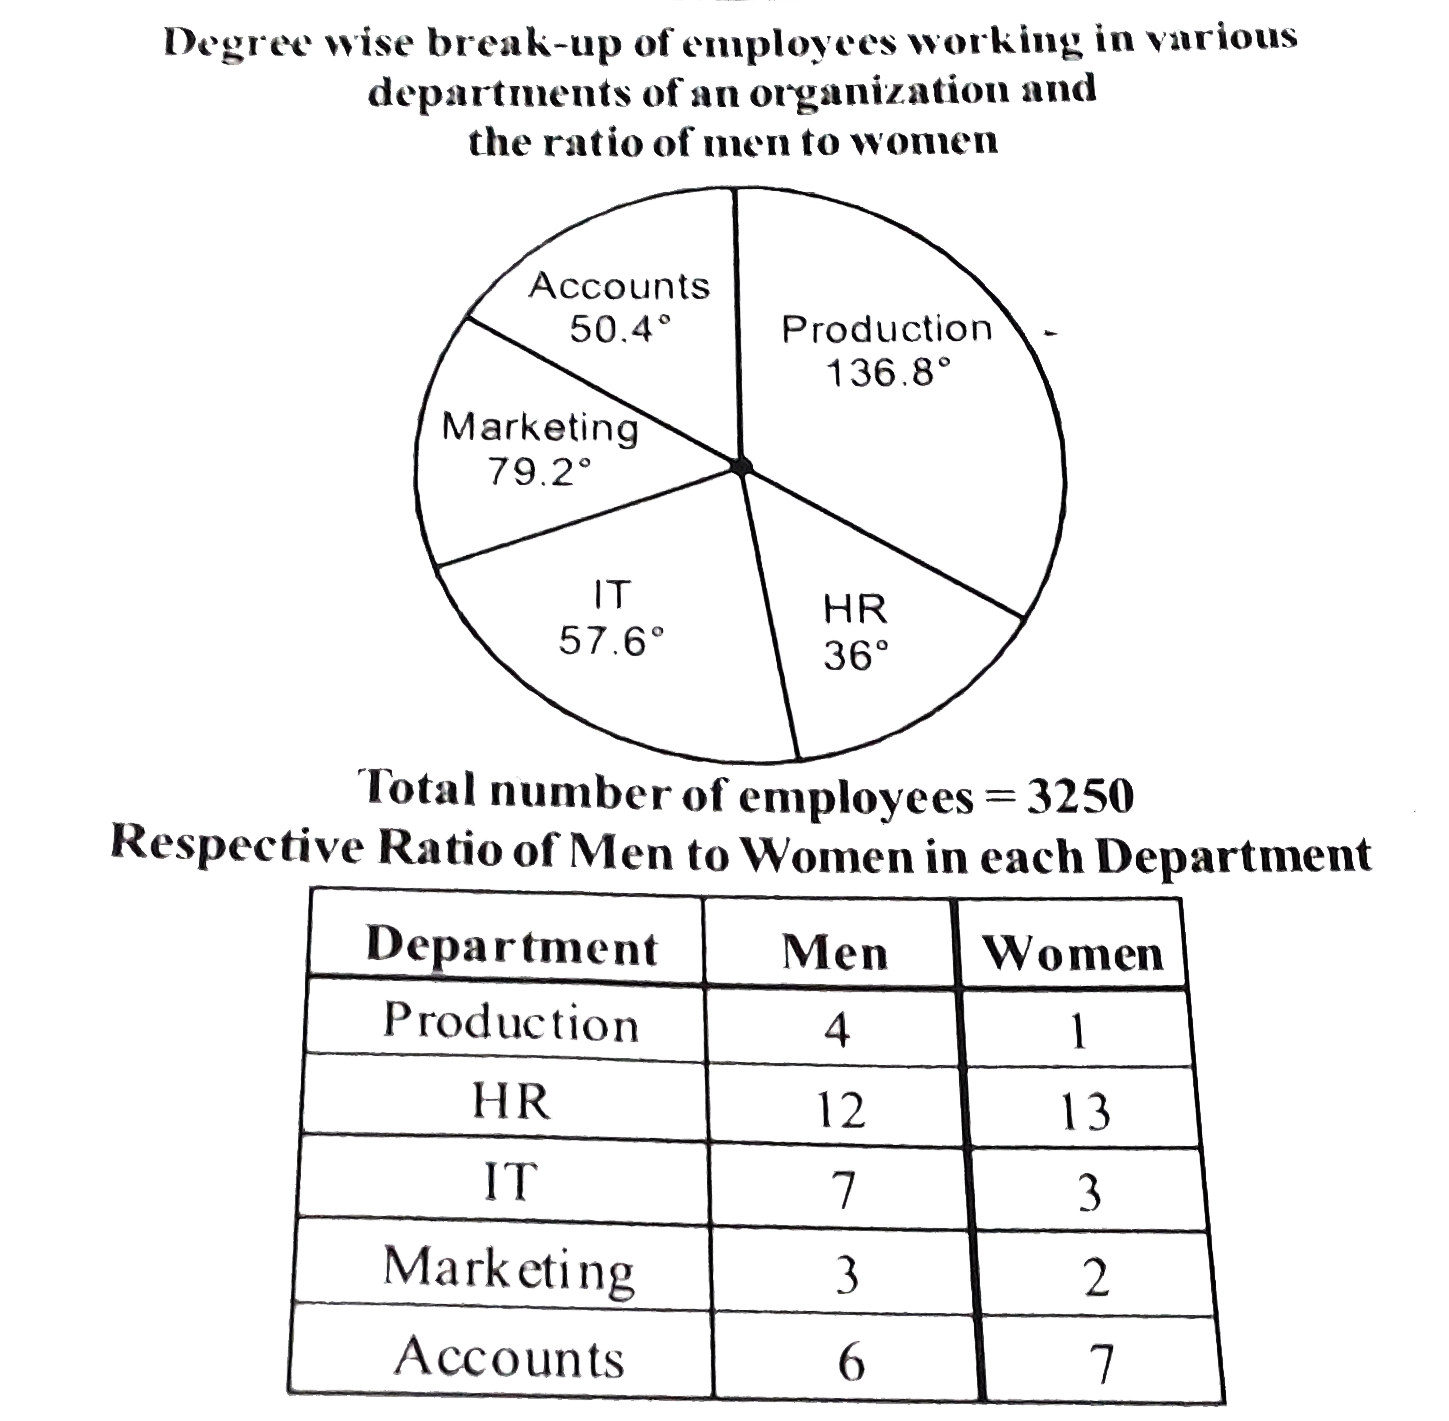
The number of women working in the IT department of the organization forms what per cent of the total number of employees in the organization from all departments together ?01:22View SolutionStudy the pie chart and answer the question
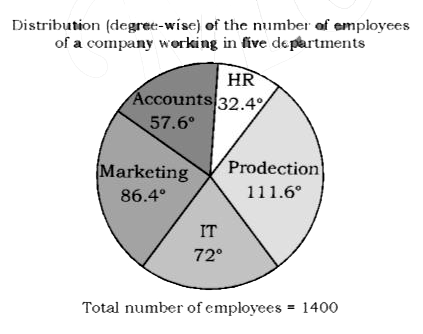
IF 80% of the number of employees working in IT department and 40% of the number of the employees working in both the HR and Accounts departments are females, then total number of female employees working in these three department is05:30View SolutionThe bar graph shows the production of the different departments of a company. Study the diagram and answer the following questions.
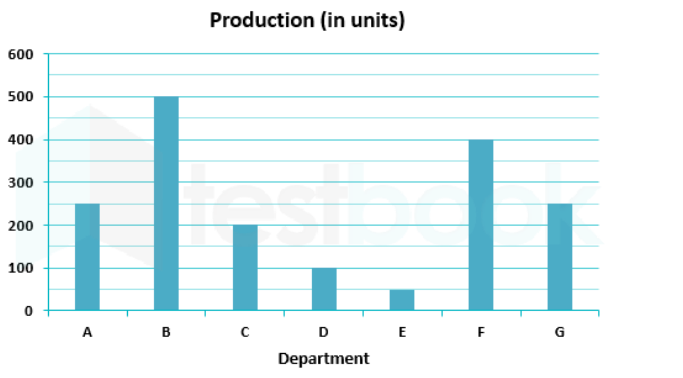
What is the ratio of production of department A to that of department F?03:38View SolutionThe given pie chart shows the percentage distribution of 450 employees in an organisation. Read the pie chart and answer the question that follows. Percentage of Employees in different Departments (Total 450 Employees ) What is the number of employees working in department F?
03:32View Solution

