Read the following pie-chart carefully and answer the questions given below :
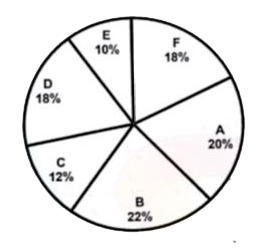
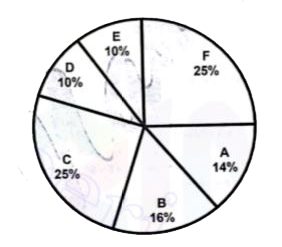
Distribution of total voters from six different cities and the distribution of female voters among these cities.
Total number of voters=64000
Ratio of males and females = 5 : 3

Percentage distribution of female voters

The number of male voters in city C is what percent of the number of male voters in city D ? (approx)
A) 67
B) 48
C) 30
D) 18
The correct Answer is:D
Step by step video, text & image solution for Read the following pie-chart carefully and answer the questions given below : Distribution of total voters from six different cities and the distribution of female voters among these cities. Total number of voters=64000 Ratio of males and females = 5 : 3 Percentage distribution of female voters The number of male voters in city C is what percent of the number of male voters in city D ? (approx) by Maths experts to help you in doubts & scoring excellent marks in Class 14 exams.
Topper's Solved these Questions
Similar Questions
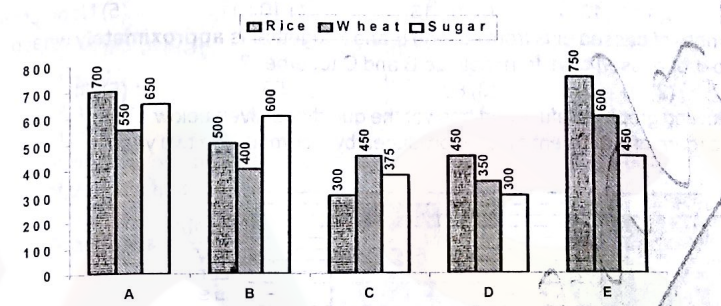
Study the following graph carefully and answer the question given below-
Amount of Rice, Wheat and Sugar Consumed by various restaurants over a years.

What is the respective ratio of the amount of Rice, Wheat and Sugar consumed by restaurant D to the same consumed by restaurant B ?06:07View SolutionIn one hour,a boat goes 11 km along the stream and 5 km against the stream. Then speed of the boat in still water (in km/hr) is :
02:11View SolutionThe total of the present ages of A,B,C and D is 96 years. What is B's present age ?
(i) The average age of A, B and D is 20 years.
(ii) The average age of C and D is 25 years.01:31View SolutionWhich of the following are correct chain isomers of butane ? (i)
02:45View SolutionDetermine the point of symmetry of a regular hexagon.
02:17View SolutionDtermine the images of the following figure about the given line :
05:41View SolutionMatch the following Column A to Column B
 02:21View Solution
Match the following Column A to Column B
 02:03View Solution
Match the following Column A to Column B
 02:10View Solution
Find the area of the figure given below.
 02:17View Solution
The area of the shaded part in the figure given below is ______.
 02:10View Solution
The inequation represented by the graph given below is :
04:23View SolutionThe inequation that best describes the graph given below is _________
03:02View SolutionThe inequation that best describes the following graph is _________
01:52View SolutionWhich inequations represent the shaded region in the given figure
01:54View SolutionIn the given figure, PQRS is a parallelogram. A and B are the mid-point of ¯¯¯¯¯¯PQ and ¯¯¯¯¯SR respectively. If PS=BR, then the quadrilateral ADBC is a…………………… ,
ltimg src="https://d10lpgp6xz60nq.cloudfront.net/physics_images/PS_MATH_IX_C12_E05_020_Q01.png" width="80%"gt02:22View Solution

