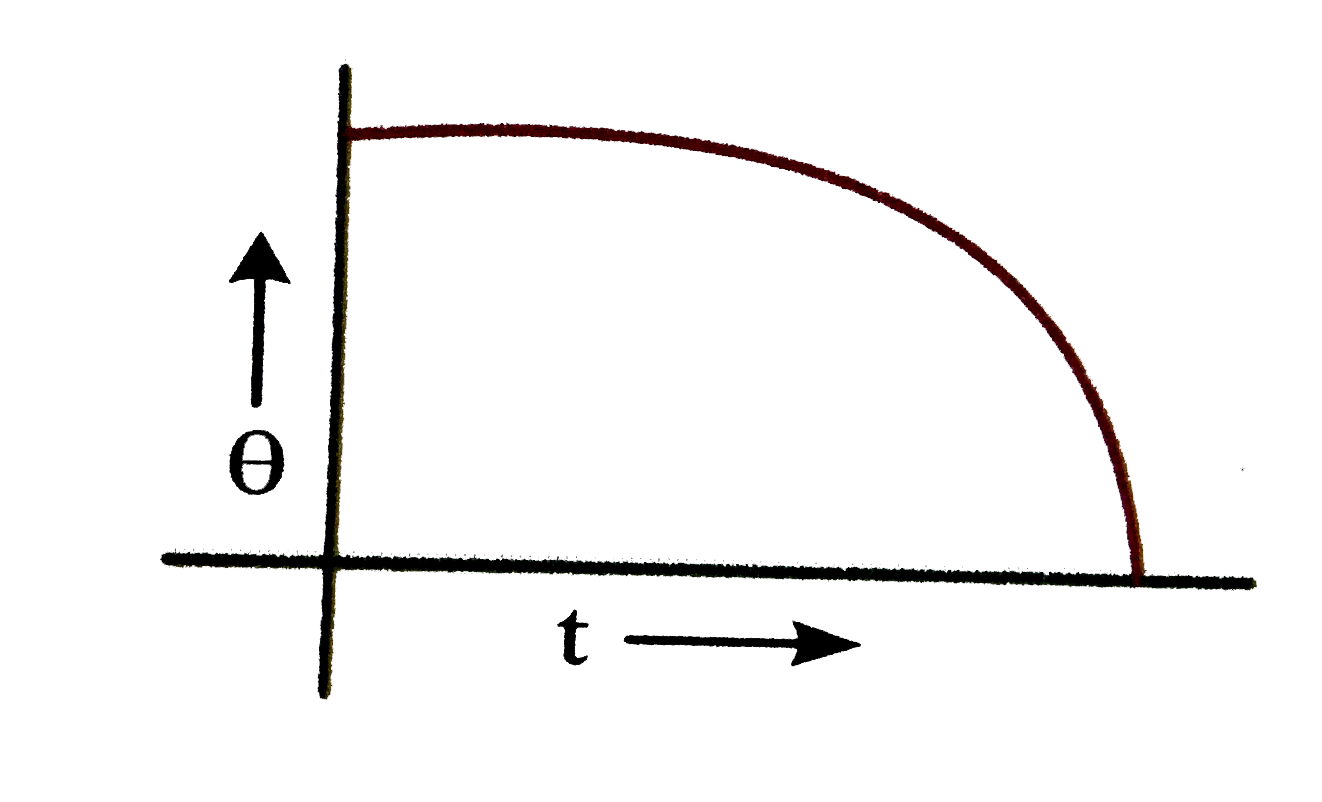
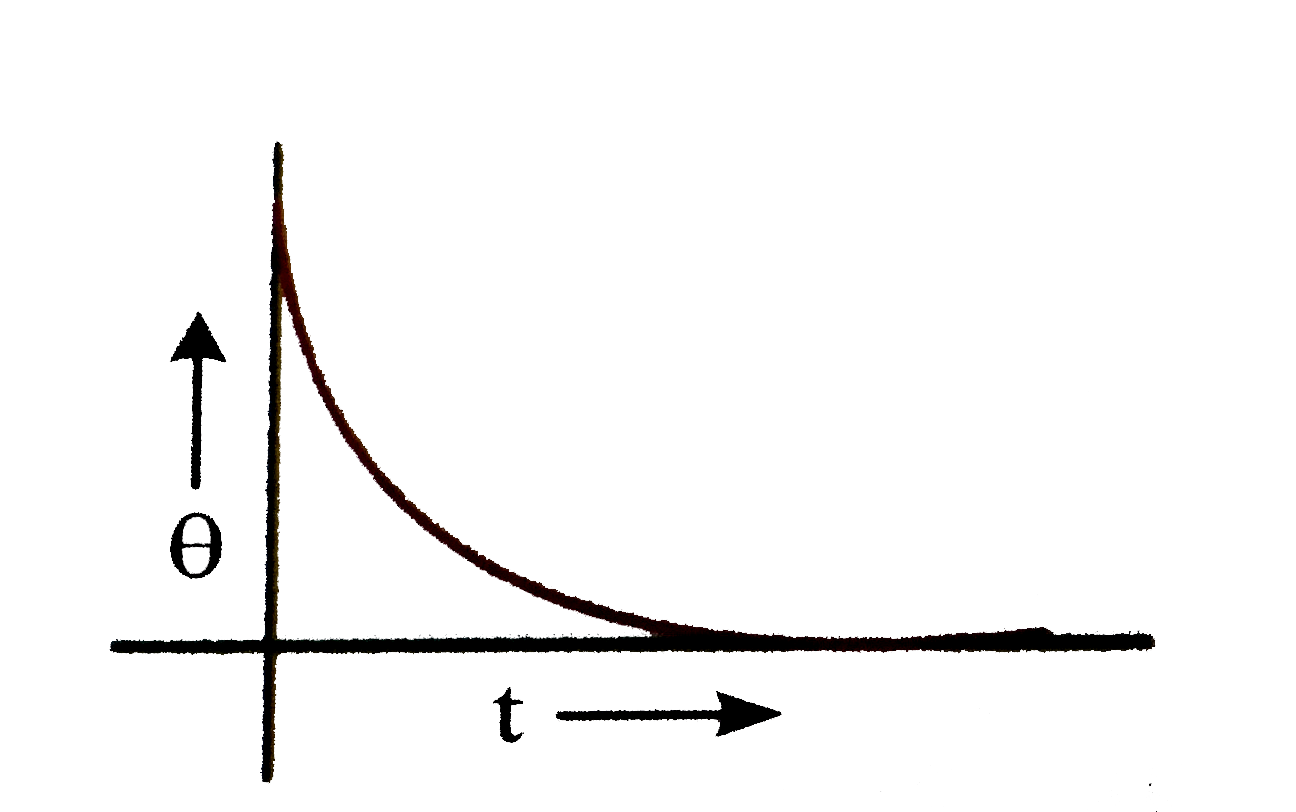
In the experiment to study relationship between temperature of the body and time if a graph is plotted between loge (T−Ts) taking along y-axis and time (t) taking along x-axis, it is:
A
exponential
B
straight line
C
parabola
D
hyperbola
Text Solution
The correct Answer is:B
|
Updated on:21/07/2023
Similar Questions
Knowledge Check
- Question 1 - Select One
In the experiment to study relationship between temperture of the body and time if a graph is plotted between log(θ−θ0) taking it along y−axis and time (t) taking along x−along, it is
AexponentialBstraight lineCparabolaDhyperbola - Question 2 - Select One
If a cooling curve is drawn taking t(s) along X−axis and temperature (θ) along Y−axis, it appers as
A B
B C
C D
D
- Question 3 - Select One
A graph is plotted taking .∘C along the Y-axis and .∘F along the X-axis. It is a/an
AparabolaBstraight lineCellipseDcircle
A particle starts with uniform acceleration. Draw a graph taking the displacement(s) of the particle along y-axis and time(t) along x-axis. What is the curve known as?
View SolutionA particle starts with uniform acceleration. Draw a graph taking the displacement(s) of the particle along y-axis and time(t) along x-axis. What is the curve known as?
View SolutionThe graph between the object distance along the X-axis and image distance along Y-axis for a convex lens is
View SolutionA graph is plotted taking ∘––C along the Y - axis and of along the X - axis .It is a /an
View SolutionFor a first order reaction, when a graph is plotted between log10([A])0([A])t on y-axis and time (t) on x-axis , slope of the graph of the graph is equal to __________.
View Solution
