Fit a trend line to the data in Problem IV (1) by the method of least squares.
The correct Answer is:(##MSBTPCRMATSCXIIP2C04E02032_A01##)
Similar Questions
Use the method of least squares to fit a trend line to the data in Problem 6 below. Also, obtain the trend value for the year 1975.
View SolutionFollowing table shows the amount of sugar production (in lac tons) for the years 1971 to 1982.

Fit a trend line by the method of least squares.
View Solution
Knowledge Check
(##KPL_SAT_PRD_PLS_C09_E01_004_Q01.png" width="80%">
The scaterplot abouve shows data collected each year after the British Parlimament enacted a mandatory seat belt law and line of beast fit to the data. Which of the following equations best represents the trend of the data shown in the figure ?Ay=0.4x+25By=1.8x+15Cy=2.1x+35Dy=2.6x+25
The following table gives the production of steel (in millions of tons) for years 1976 to 1986.

Fit a trend line by the method of least squares. Also, obtain the trend value for the year 1990.
View SolutionSolve the equation 10x−1x=3 by the method of completing the square.
View SolutionFollowing table shows the all India infant mortality rates (per ‘000) for years 1980 to 2000.

Fit a trend line by the method of least squares.
View SolutionObtain trend values for data in Problem 1 using 4-yearly centered moving averages.
View SolutionFit a straight line to the following data treating y as the dependent variable

View Solution
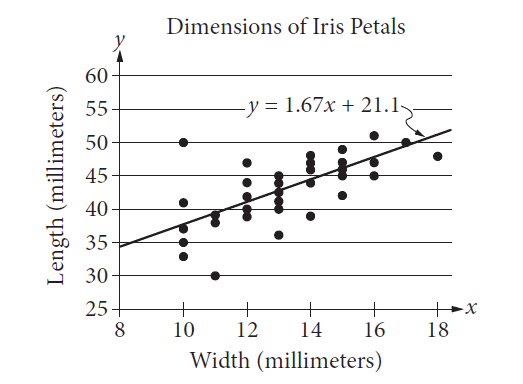
The scatterplot above shows data collected on the lengths and widths of Iris setosa petals. A line of best fit for the data is also shown. Based on the line of best fit, if the width of an Iris setosa petal is 19 millimeters, what is the predicted length, in millimeters, of the petal?
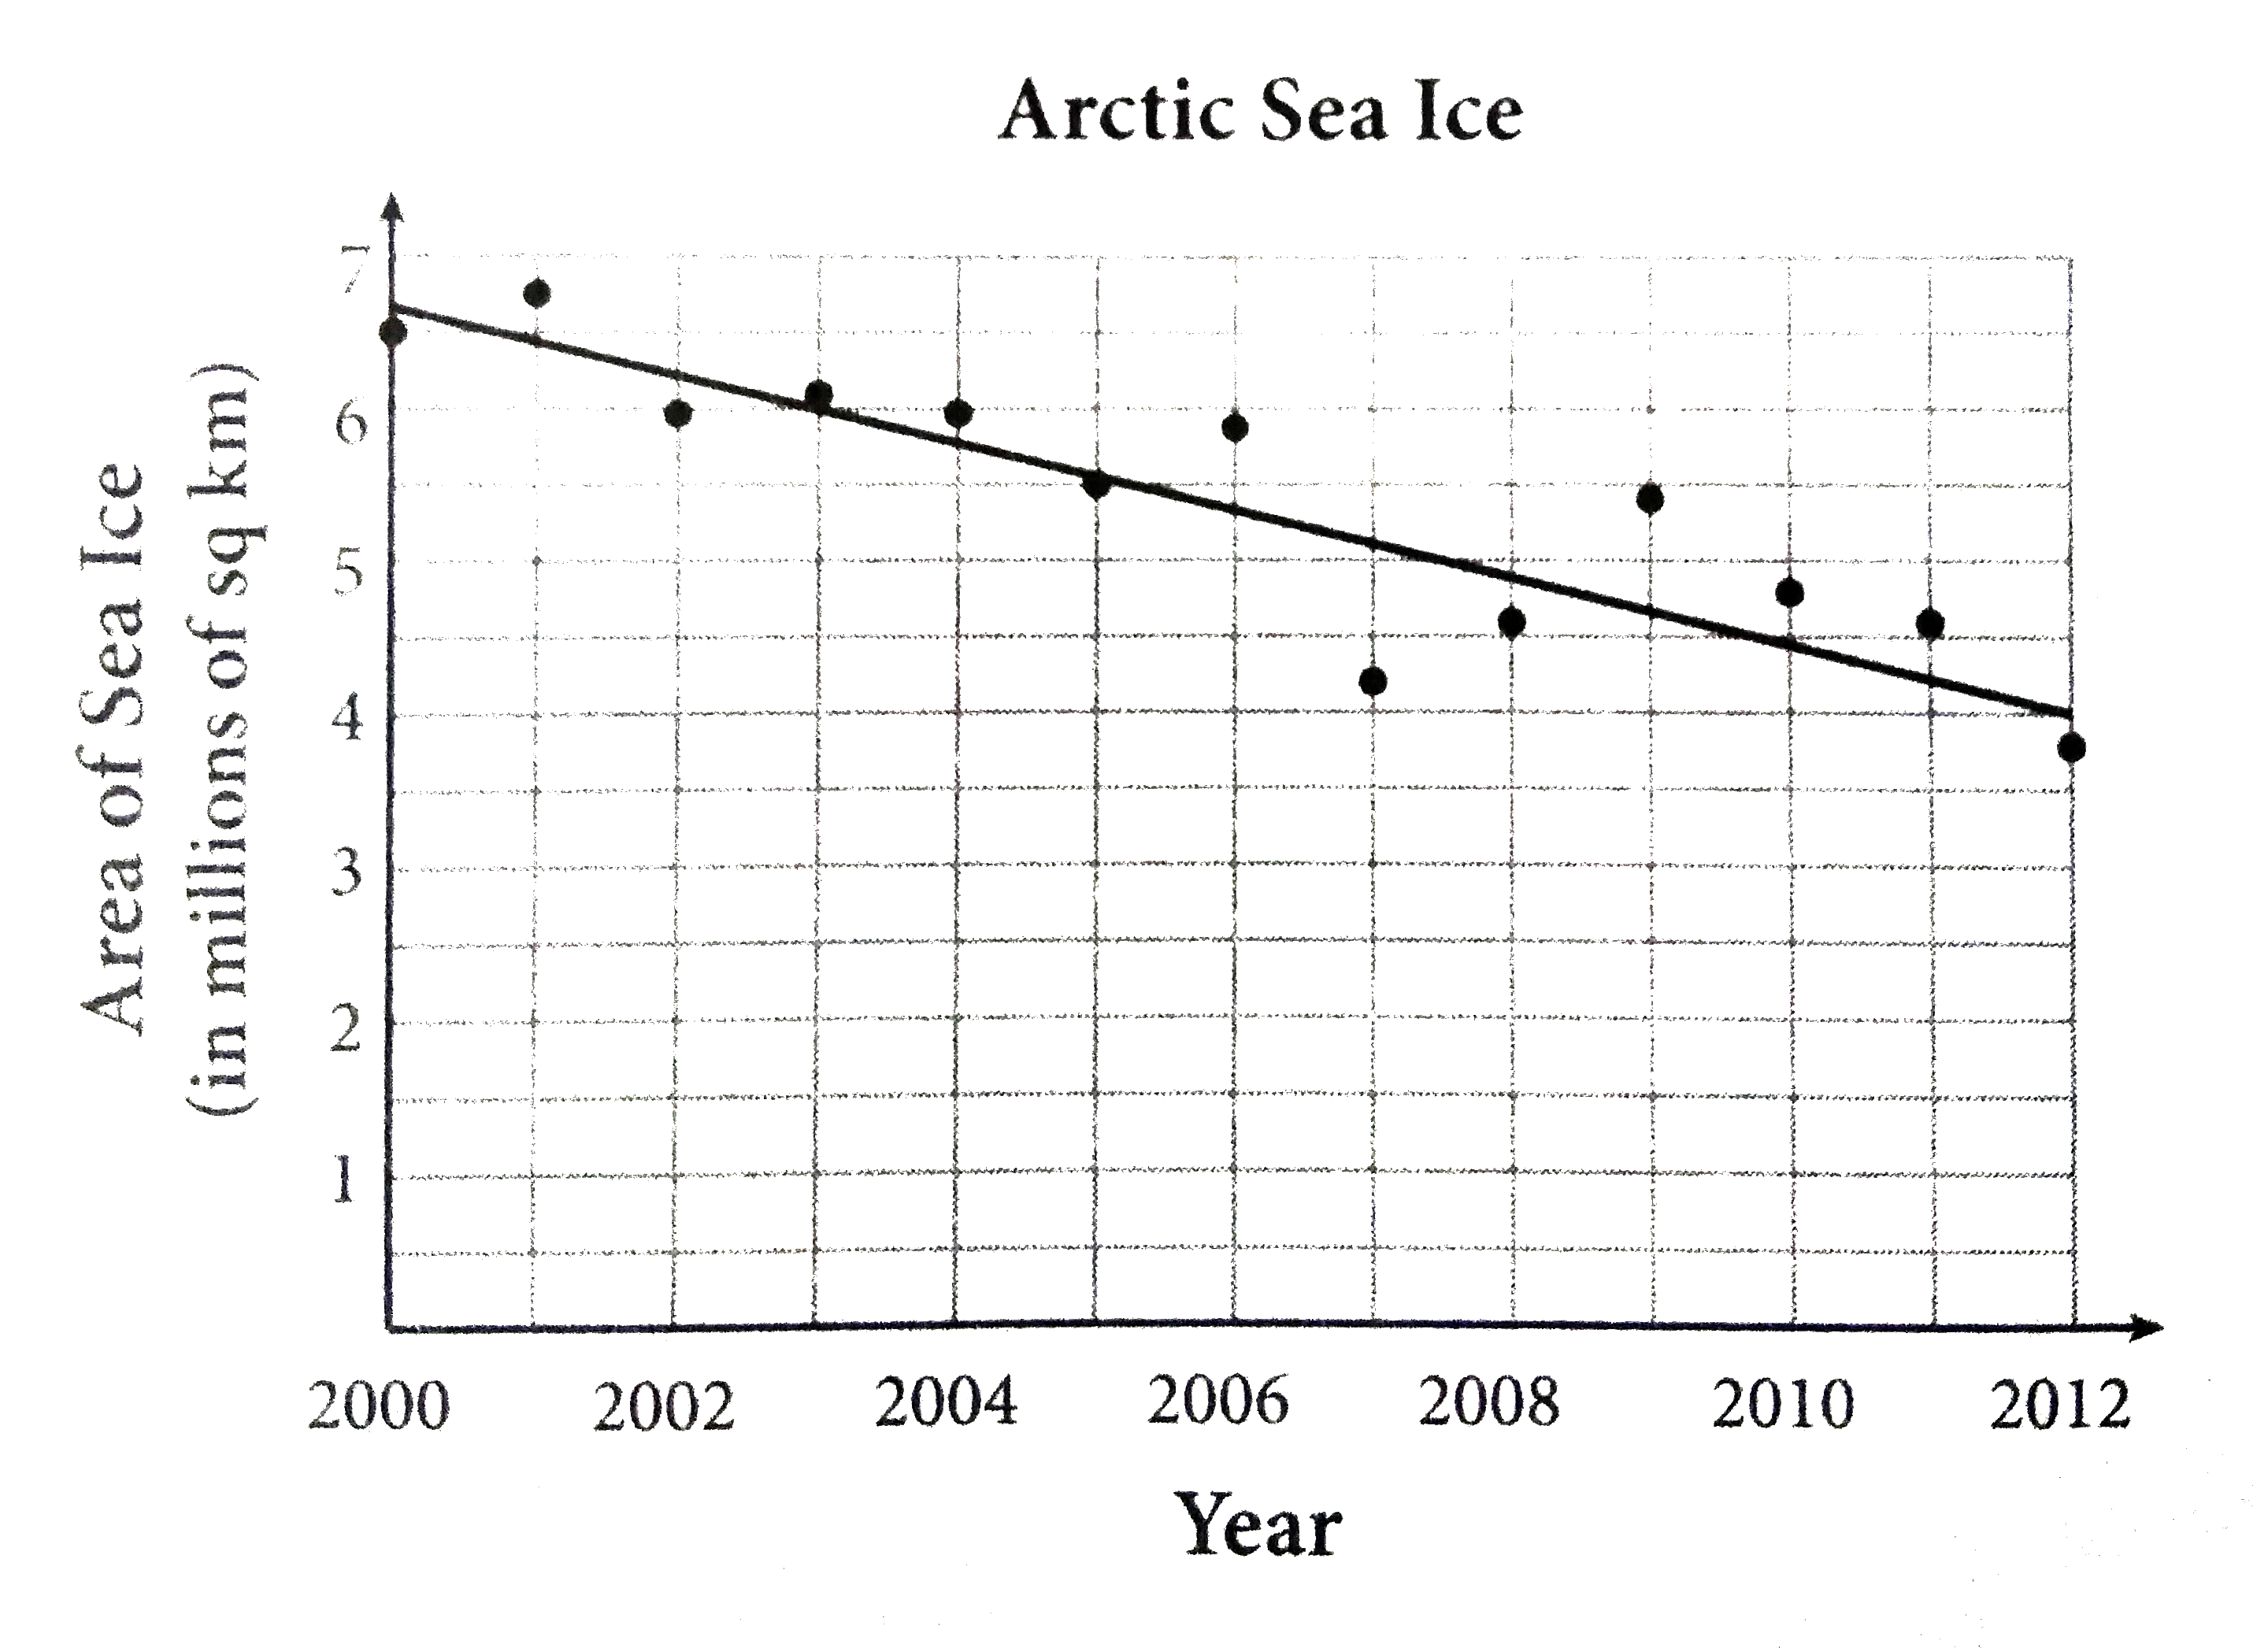
View SolutionSea ice extent is a measurement of the area of ocean with at least 15% sea ice. The graph below shows data for the extent of Artic sea ice between 2000 and 2012 as reported by the National Snow and Ice Data Center. The line of best fit is also shown. The equations of the line is A(t)=−0.187t+380.5, where A(t) represents the area of measurement sea ice in the Artic Ocean in the year t.

Q. Assuming the trend of the data continues in what year will the measurable sea ice in the Arctic Ocean cease to exist?
View Solution
