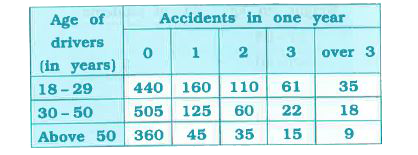
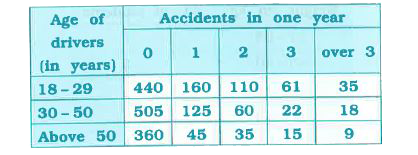
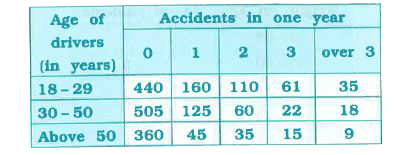
An insurance company selected 2000 drivers at random (i.e., without any preference of one driver over another) in a particular city to find a relationship between age and accidents. The data obtained is given in the following table:

Find the probabilities of the following events for a driver chosen at random from the city:
(i) The driver being in the age group 18-29 years and having exactly 3 accidents in one year.
(ii) The driver being in the age group of 30-50 years and having one or more accidents in a year.
(iii) Having no accidents in the year.Solution in Telugu
The correct Answer is:(i) , (ii) , (iii)
Step by step video, text & image solution for An insurance company selected 2000 drivers at random (i.e., without any preference of one driver over another) in a particular city to find a relationship between age and accidents. The data obtained is given in the following table: Find the probabilities of the following events for a driver chosen at random from the city: (i) The driver being in the age group 18-29 years and having exactly 3 accidents in one year. (ii) The driver being in the age group of 30-50 years and having one or more accidents in a year. (iii) Having no accidents in the year. by Maths experts to help you in doubts & scoring excellent marks in Class 9 exams.
Updated on:21/07/2023Similar Questions
An insurance company selected 2000 drivers at random (i.e., without any preference of one driver over another) in a particular city to find a relationship between age and accidents. The data obtained are given in the following table:A g e\ o
View SolutionAn insurance company selected 2000 drivers at random (i.e., without any preference of one driver over another) in a particular city to find a relationship between age and accidents. The data obtained are given in the following table: Find the probabilities of the following events for a driver chosen at random from the city: (i) The driver being in the age group 18−29 years and having exactly 3 accidents in one year. (ii) The driver being in the age group of 30−50 year and having one or more accidents in a year. (iii) The number of drivers having no accidents in one year
View SolutionAn insurance company selected 2000 drivers at random (i.e., without any preference of one driver over another) in a particular city to find a relationship between age and accidents . The data obtained are given in following table :

Find the probabilities of the following events for a driver chosen at random from the city.
being 18-29 years of age and having exactly 3 accidents in one year.
View SolutionAn insurance company selected 2000 drivers at random (i.e., without any preference of one driver over another) in a particular city to find a relationship between age and accidents . The data obtained are given in following table :

Find the probabilities of the following events for a driver chosen at random from the city.
being 30-50 years of age and having one or more accidents in a year.
View SolutionAn insurance company selected 2000 drivers at random (i.e., without any preference of one driver over another) in a particular city to find a relationship between age and accidents . The data obtained are given in following table :

Find the probabilities of the following events for a driver chosen at random from the city.
having no accidents in one year
View SolutionAn insurance company selected 2000 drivers at random (i.e., without any preference of one driver over another) in a particular city to find a relationship between age and accidents . The data obtained are given in following table :

Find the probabilities of the following events for a driver chosen at random from the city.
being 18-29 years of age and having exactly 3 accidents in one year.
View SolutionAn insurance company selected 2000 drivers at random (i.e., without any preference of one driver over another) in a particular city to find a relationship between age and accidents . The data obtained are given in following table :

Find the probabilities of the following events for a driver chosen at random from the city.
being 30-50 years of age and having one or more accidents in a year.
View SolutionAn insurance company selected 2000 drivers at random (i.e., without any preference of one driver over another) in a particular city to find a relationship between age and accidents . The data obtained are given in following table :

Find the probabilities of the following events for a driver chosen at random from the city.
having no accidents in one year
View Solution
