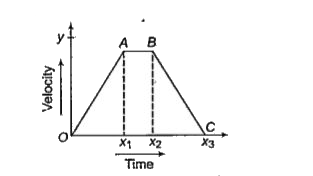
The figure denotes velocity-time graph, displace ment is equal to
y(x1+x2+x3)
y(x3−x1)
y(x3−x2−x1)
y2(x3+x2−x1)
The correct Answer is:D
The area enclosed between velocity-time curve and the time axis gives displacement.
OABC is trapezium. Side OC=x3, side
AB=(x2−x1)
Height = y
∴ Area =12×Height ×(Sum of parallel side)
Area =12×y×(x3+x2−x1)
∴ Displacement =y2(x3+x2−x1)
Similar Questions
Acceleration-time graph of a moving object is shown in figure. Draw the velocity- time graph and displacement-time graph corresponding to this type of motion.
 .
.
View SolutionDraw the velocity-time graph for an object in uniform motion. Show that the area under the velocity-time graph gives the displacement of the object in the given time interval.
View Solution
Knowledge Check
The figure shows a velocity-time graph of a particle moving along a straight line
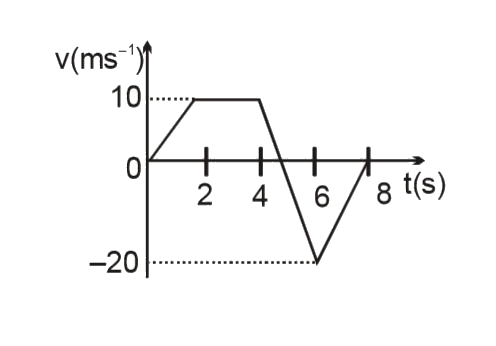
Q. The correct displacement-time graph of the particle is shown asA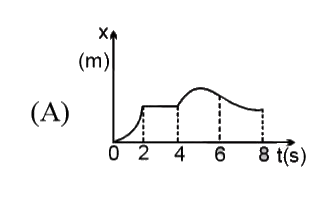 B
B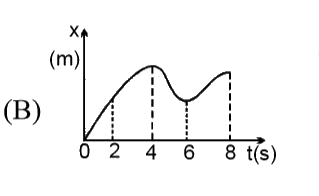 C
C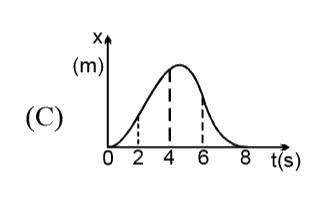 D
D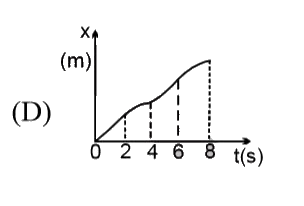
The figure shows a velocity-time graph of a particle moving along a straight line
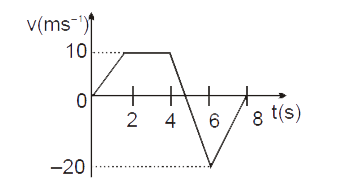
The maximum of displacement of the particle isA33.3 mB23.3 mC18.3DzeroThe figure shows a velocity-time graph of a particle moving along a straight line
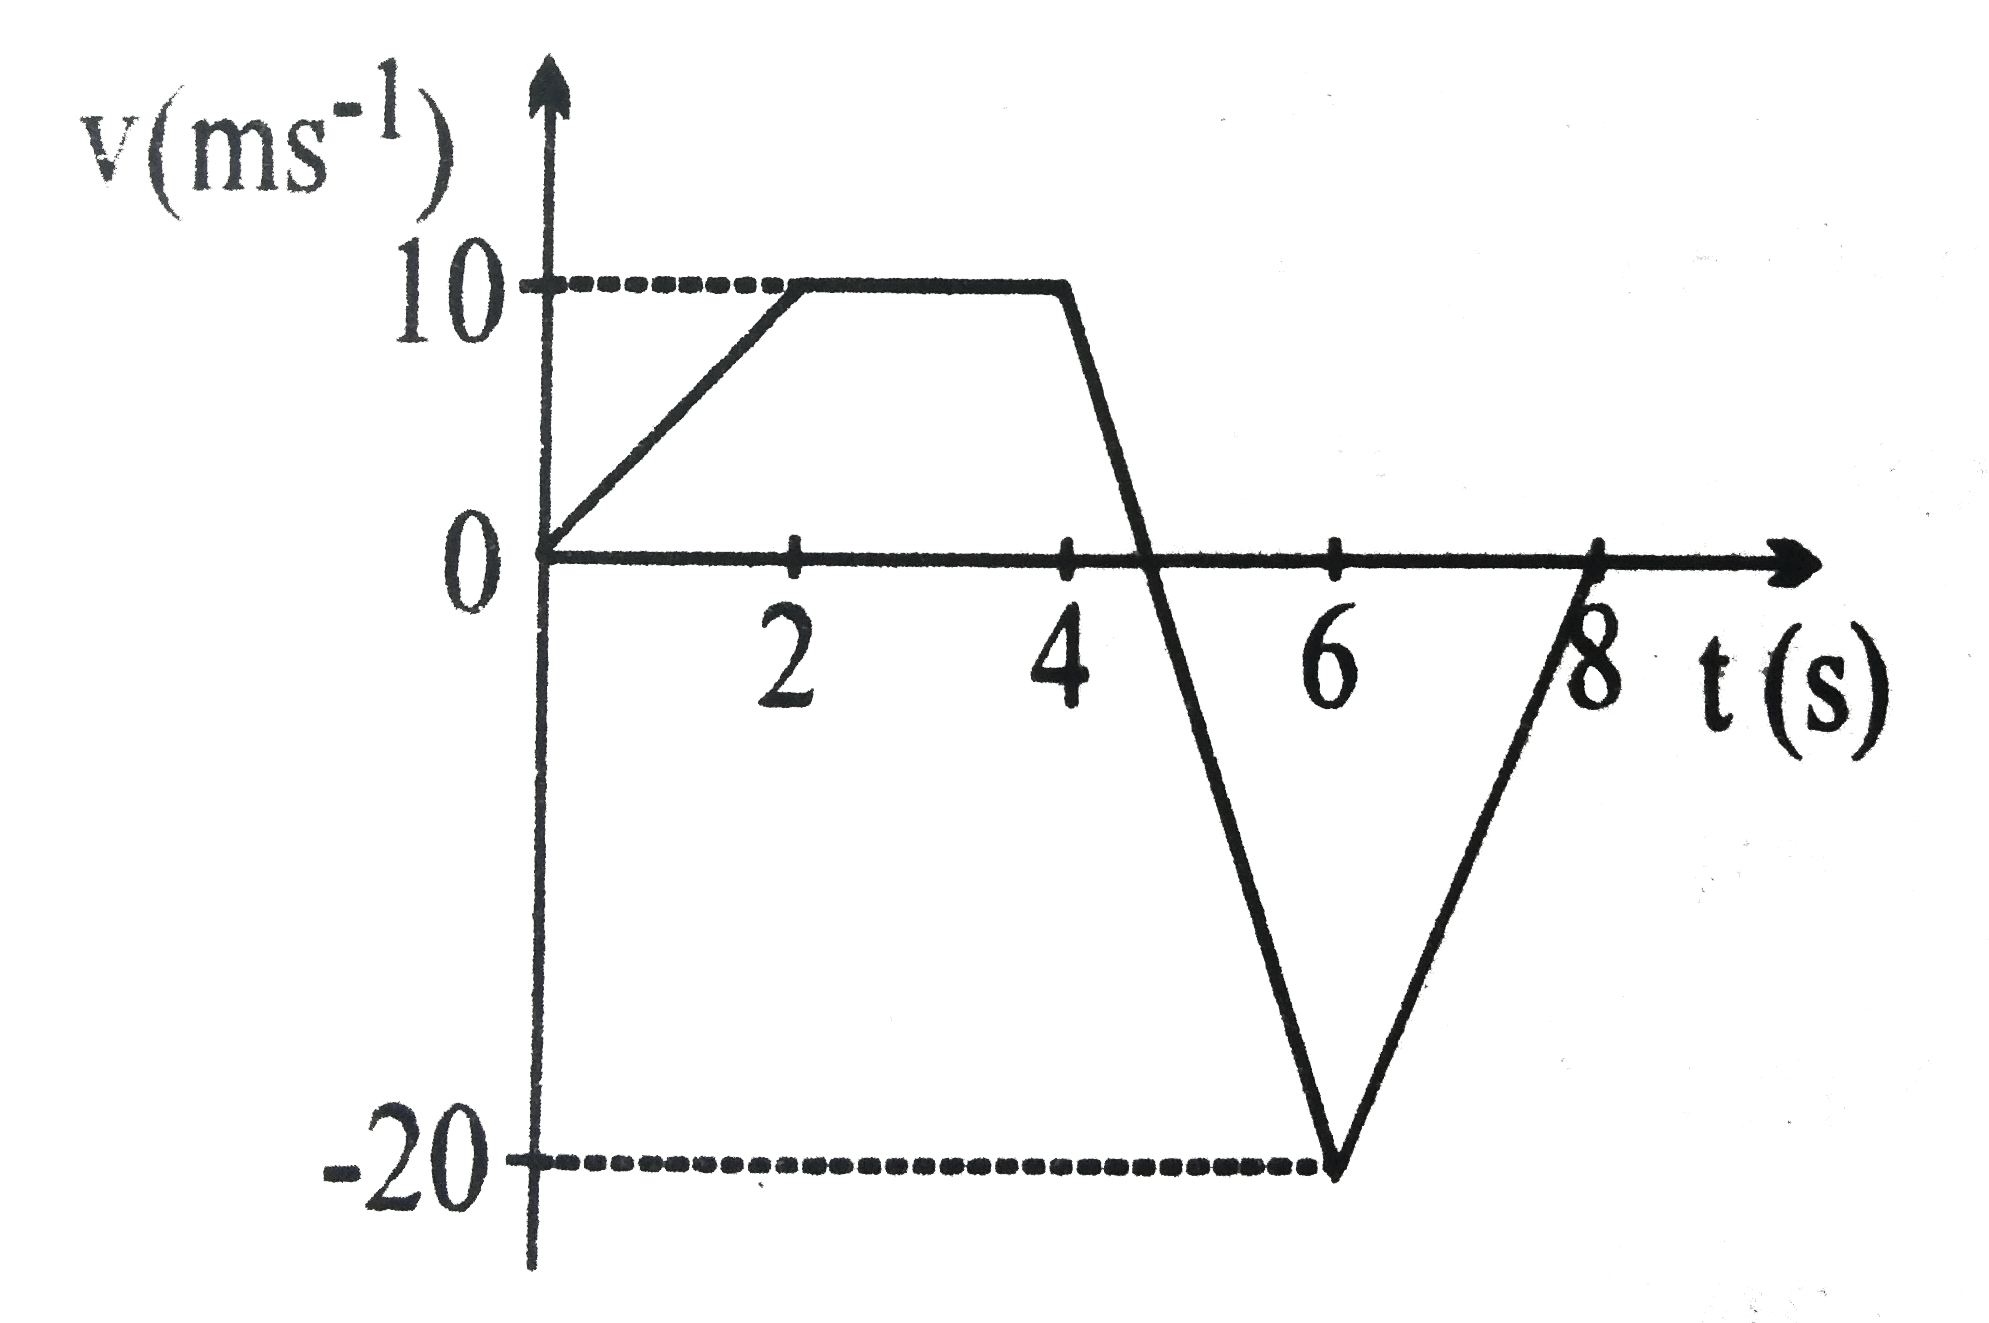
The maximum displacement of the particle isA33.3mB23.3mC18.3mDzero
A displacement -time graph of a body moving with uniform velocity is shown in the figure. Find out its velocity and its displacement at the end of 5 seconds
View SolutionThe figure below shows the velocity-time graph of a body moving in a straight line.
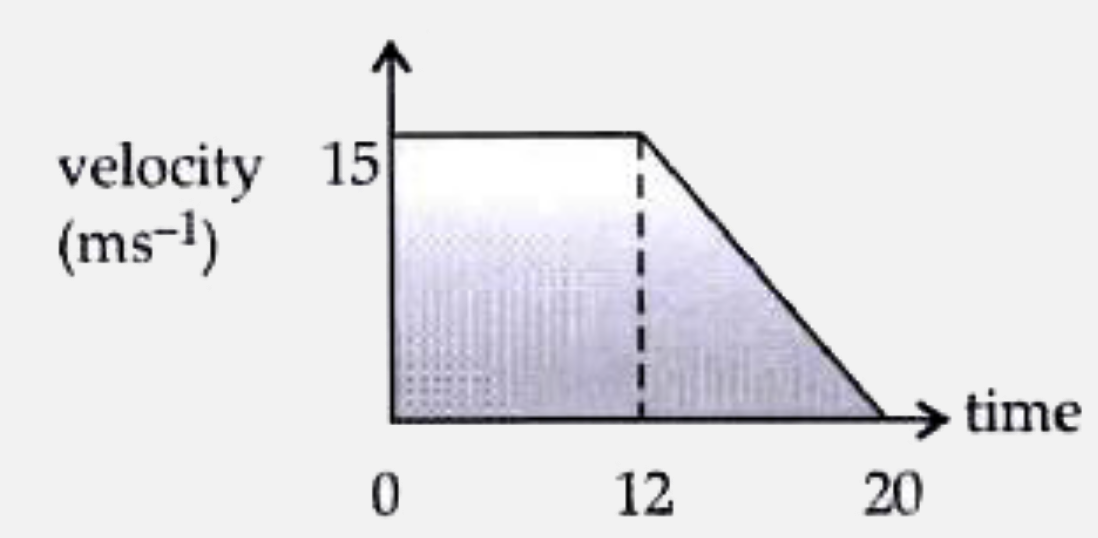
Find the total displacement of the body.
View SolutionThe figure shows a velocity-time graph of a particle moving along a straight line
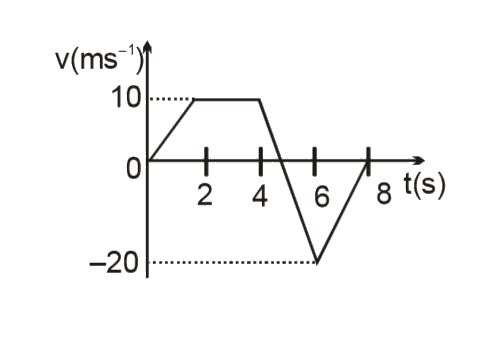
Q. The maximum of displacement of the particle is
View SolutionAssertion: Area under velocity-time graph give displacement.
Reason: Area under acceleration-time graph give velocity.
View SolutionThe displacement time graph of a body is shown in figure. The velocity-time graph of the motion of the body will be
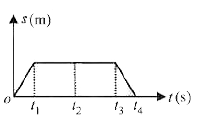
View Solution
