From the graph of photoelectric current versus collector plate potential is shown in the figure we conclude that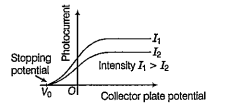
maximum KE of photoelectrons is independent of intensity
maximum KE of photoelectrons is depends of intensity
minimum KE of photoelectrons is independent of intensity
minimum KE of photoelectrons is depends of intensity
The correct Answer is:A
Similar Questions
The graph of Fig. shows the variation of photoelectric current with collector plate potential for different frequencies of incident radiations.
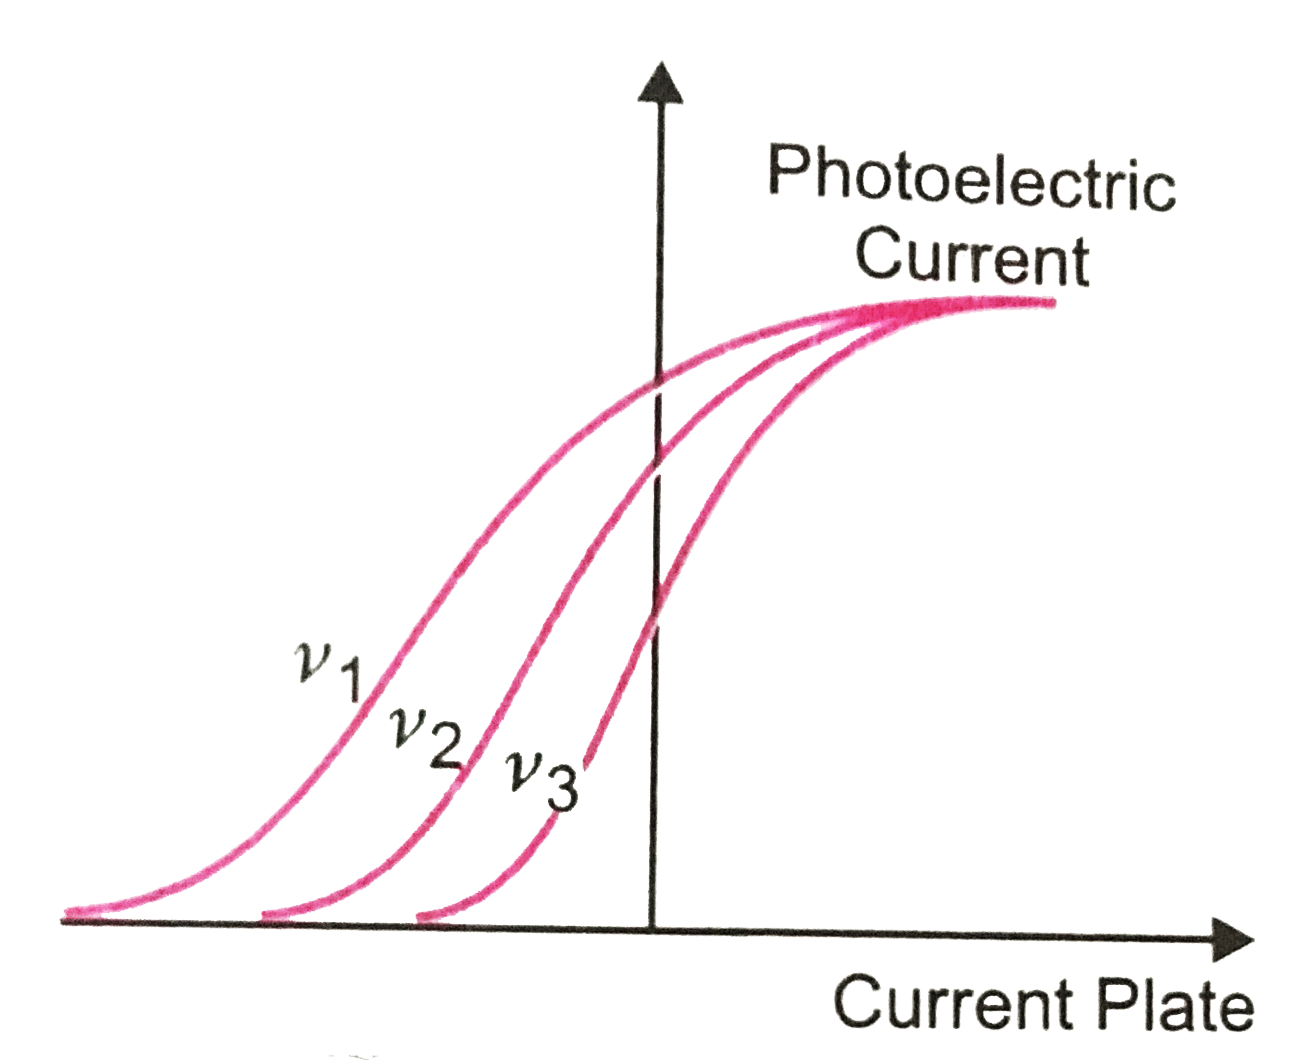
(i) Which physical parameter is kept constant for the three curves?
(ii) Which frequency (v1,v2orv3) is the highest?
View SolutionDraw suitable graphs to show the variation of photoelectric current with collector plate potential for
(i) a fixed frequency but different intensities I1>I2>I3 of radiation.
(ii) a fixed intensity but different frequencies v1>v2>v3 of radiation.
View Solution
Knowledge Check
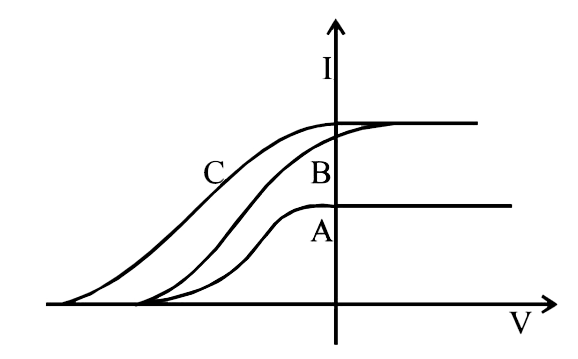
For the graph of collector plate potential versus photoelectric current is as shown in the figure if I denotes intensity of incident radiation then
 AIA>IB>ICBIA<IB<i−CCIA=IB=ICDIB>IAandIB<IC
From the following graph of photocurrent against collector plate potential, for two different intensities of light I1andI2 one can conclude.
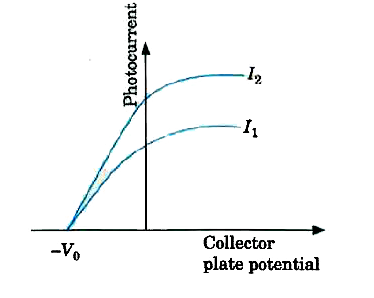 AI1=I2BI1>I2CI1<I2DComparison is not possible
Pressure versus density graph of an ideal gas is shown in figure
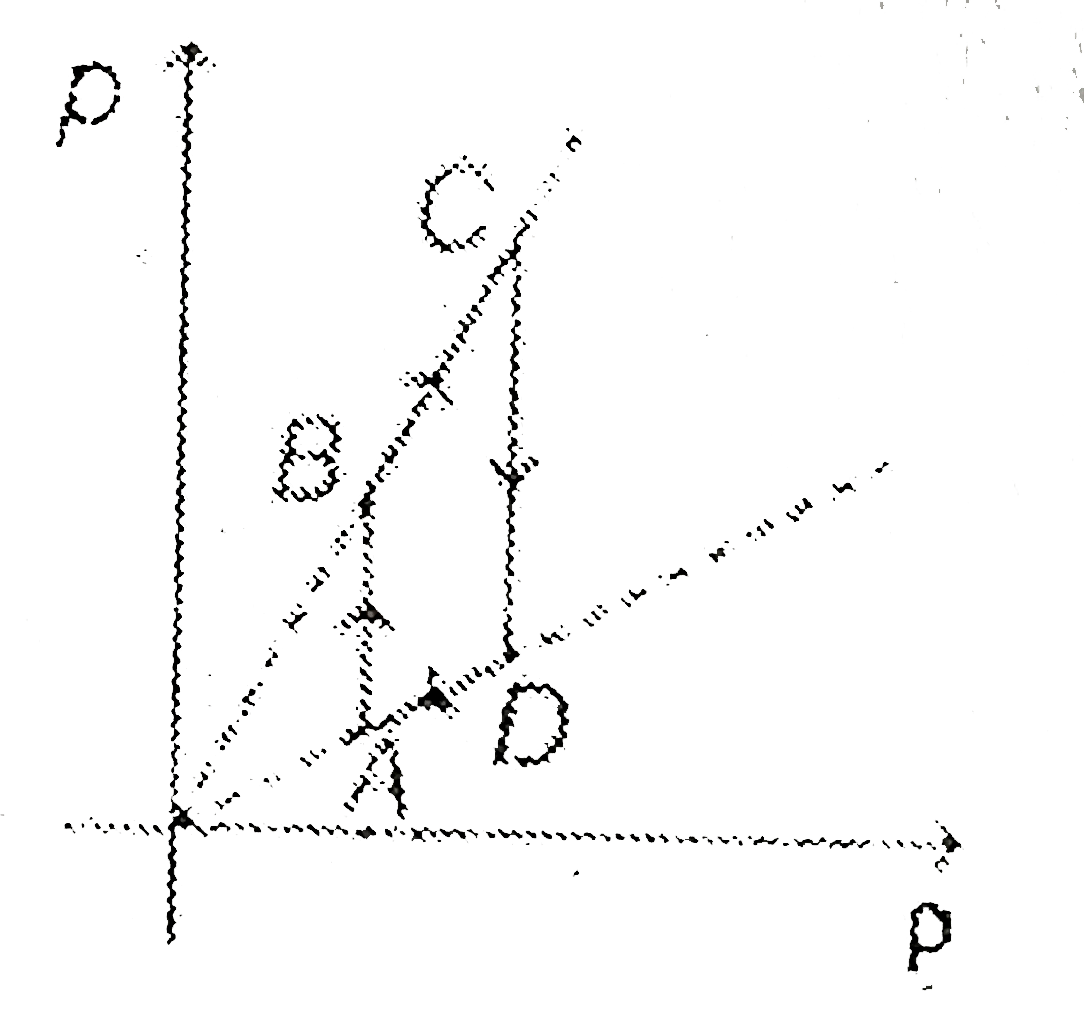 Aduring the process AB work done by the gas is positiveBduring the process AB work done by the gas is negativeCduring the process BC internal energy of the gas is increasingDNone of the above
From the following graph of photocurrent against collector plate potential for two different intensities of light I1andI2 one can , conclude
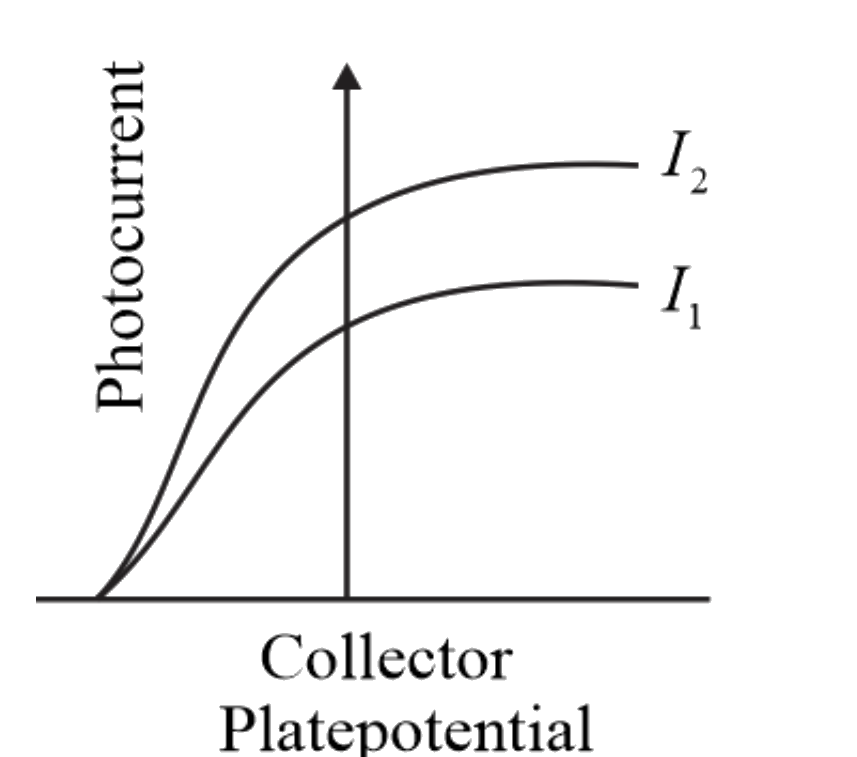
View SolutionFrom the following graph of photocurrent against collector plate potential for two different intensities of light I1andI2 one can , conclude

View SolutionIn a photoelectric experiment anode potential is ploted against plate current.
View SolutionPressure versus density graph of an ideal gas is shown in figure

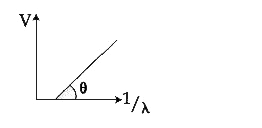
View SolutionIn a photoelectric effect experiment, the graph of stopping potential V versus reciprocal of wavelength obtained is shown in the figure. As the intensity of incident radiation is increased :
View Solution
