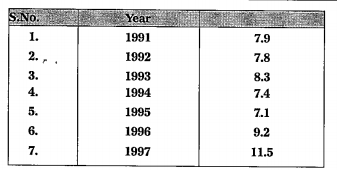
The following table shows the total power shortage percentage in India from 1991-1997. Show the data in the form of a Bar graph taking shortage percentage for the years on the Y-axi and the years on X-axis.
 Solution in Telugu
Step by step video & image solution for The following table shows the total power shortage percentage in India from 1991-1997. Show the data in the form of a Bar graph taking shortage percentage for the years on the Y-axi and the years on X-axis. by Chemistry experts to help you in doubts & scoring excellent marks in Class 8 exams.
Updated on:21/07/2023Topper's Solved these Questions
Similar Questions
Which one of the following is less polluting fuel?
View SolutionComplete the given analogy
Coal :Exhaustible::_____:Inexhaustible
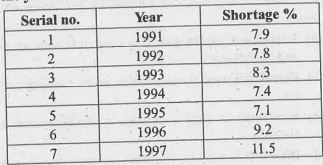
View SolutionThe following table shows the total power shortage in India from 1991-1997.show the data in form of a graph.Plot shortage percentagr for the years on the Y-axis and the year on X-axis.
View SolutionThe following table shows the ages of the students during a year are :

Find the mode.
View Solutionनिम्नलिखित सारणी में 1991 से 1997 तक भारत में विधुत की कुल कमी को दिखाया गया है। इन आँकड़ो को ग्राफ द्वारा आलेखित करिए। वर्ष में कमी प्रतिशतता को Y-अक्ष पर तथा वर्ष को X-अक्ष पर आलेखित कीजिए।
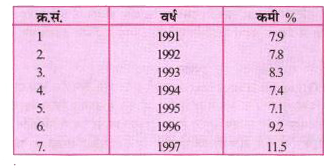
View SolutionThe following table shows the total power shortage percentage in India from 1991-1997. Show the data in the form of a Bar graph taking shortage percentage for the years on the Y-axi and the years on X-axis.

View SolutionThe following table shows the total power shortage percentage in India from 1991-1997. Show the data in the form of a Bar graph taking shortage percentage for the years on the Y-axis and the years on the X-axis. If shortage percentage of power increases year by year, how will it affect on human life ? Explain.
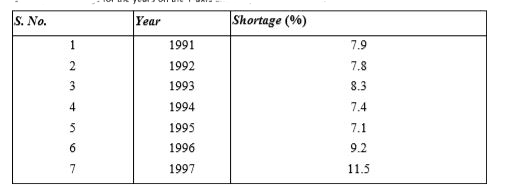
View SolutionThe following Table shows the total power shortage in India from 1991 - 1997. Show the data in the form of a graph. Plot shortage percentage for the years on the Y-axis and the year on the X-axis
View SolutionThe given bar graph depicts the number of males and females in India for the years 1951-1991. Study the graph and answer the following questions. What was the approximate percentage of female population in India during the year 1991?
View SolutionThe given bar graph depicts the number of males and females in India for the years 1951-1991. Study the graph and answer the following questions. Assuming that the percentage increase in the total population in India during the year 1991:2001 was equal to the percentage increase during the period 1981-1991, calculate the total population in India in the year 2001.
View SolutionIndia's Biscuit Exports What is the percentage decrease in the volume of export of biscuits from the year 1996 to the year 1997?
View SolutionThe bar graph shows the number of males and females (in crores) in india during 1951-1991. Read the graph and answer the following questions
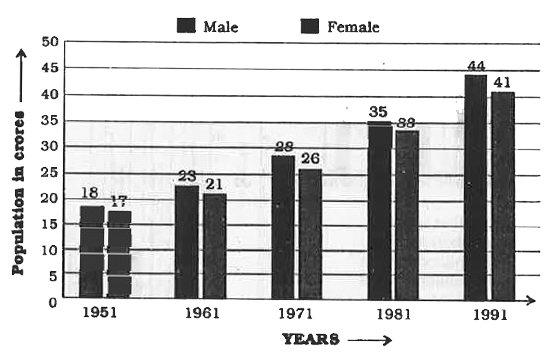
What was the approximate percentage of female population of female population in India during 1991 ?
View SolutionThe following Table shows the total power shortage in India from 1991 - 1997. Show the data in the form of a graph. Plot shortage percentage for the years on the Y-axis and the year on the X-axis

View SolutionThe following table shows the total power shortage in India from 1991-1997. Show the data in the form of a graph.
Plot shortage percentage for the years on the Y-axis and the year on the X-axis
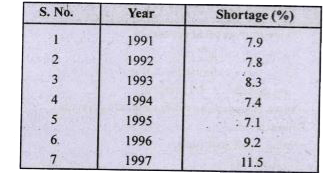
View SolutionThe following table shows the total power shortage in India from 2004-2010. Plot these data by graph. Plot the decrease-percentage in the year on the Y-axis and the year on the X-axis.
View Solutionनिम्न दण्ड (बार ) आरेख में उपविभाजित प्रतिशत के रूप में एक निर्माता के इत्र (परफ्यूम ) के उत्पादन आँकड़े दिए गए हैं।
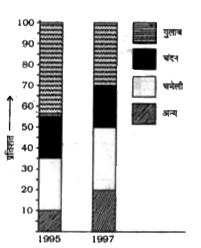
वर्ष 1995 और वर्ष 1997 में गुलाब के इत्र (परफ्यूम ) के उत्पादन का अनुपात क्या था ?
View Solution
