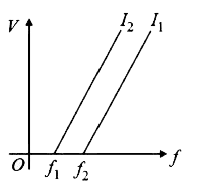
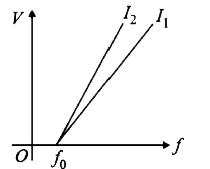
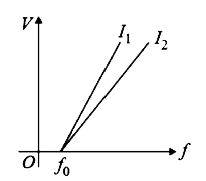
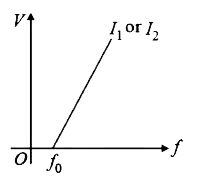
A photoelectric experiment is performed at two different light intensities I1andI2(I2>I1). Choose the correct graph showing the variation of stopping potential versus frequency of light.
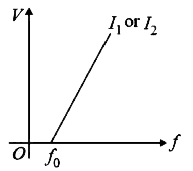
The correct Answer is:D
The value of stopping potential depends on the maximum kinetic energ9y of the photo-electron and thus it is independent of the intensity of light. Therefore, none of the graph shown is correct. The correct graph is shown in the figure.
Topper's Solved these Questions
Similar Questions
Draw and explain the graph showing the variation of stopping potential with frequency of incident radiation in relation to photoelectric effect.
View SolutionDefine photoelectric effect. Draw a graph to show the variation of stopping potential with frequency of incident radiation on a metal plate.
View Solution
Knowledge Check
- Question 1 - Select One
The maximum intensities produced by two coherent waves of intensity I1 and I2 will be:
AI1+I2BI21+I22CI1+I2+2√I1I2Dzero - Question 2 - Select One
The correct curve between the stopping potential (V) and intensity of incident light (I) is
A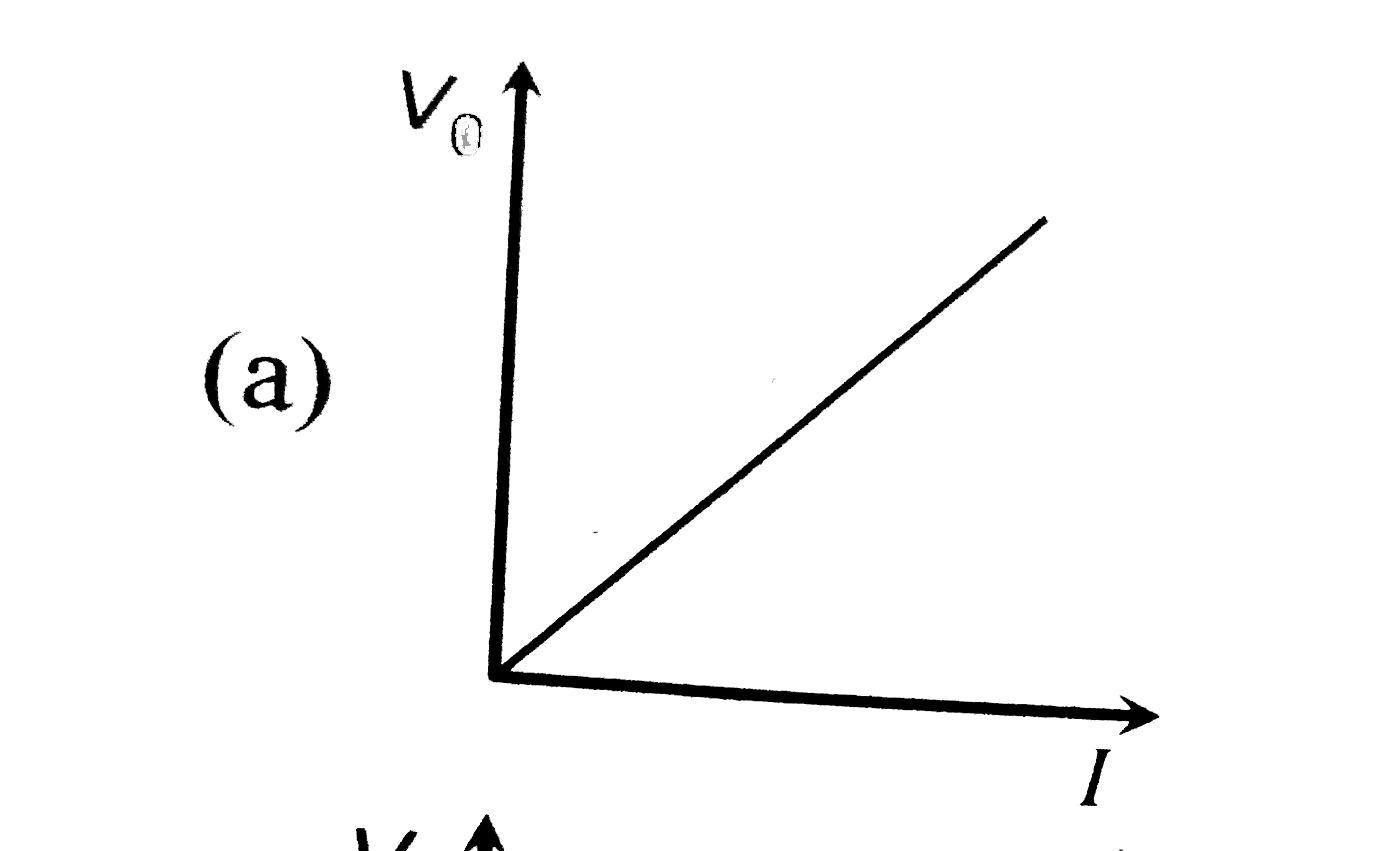 B
B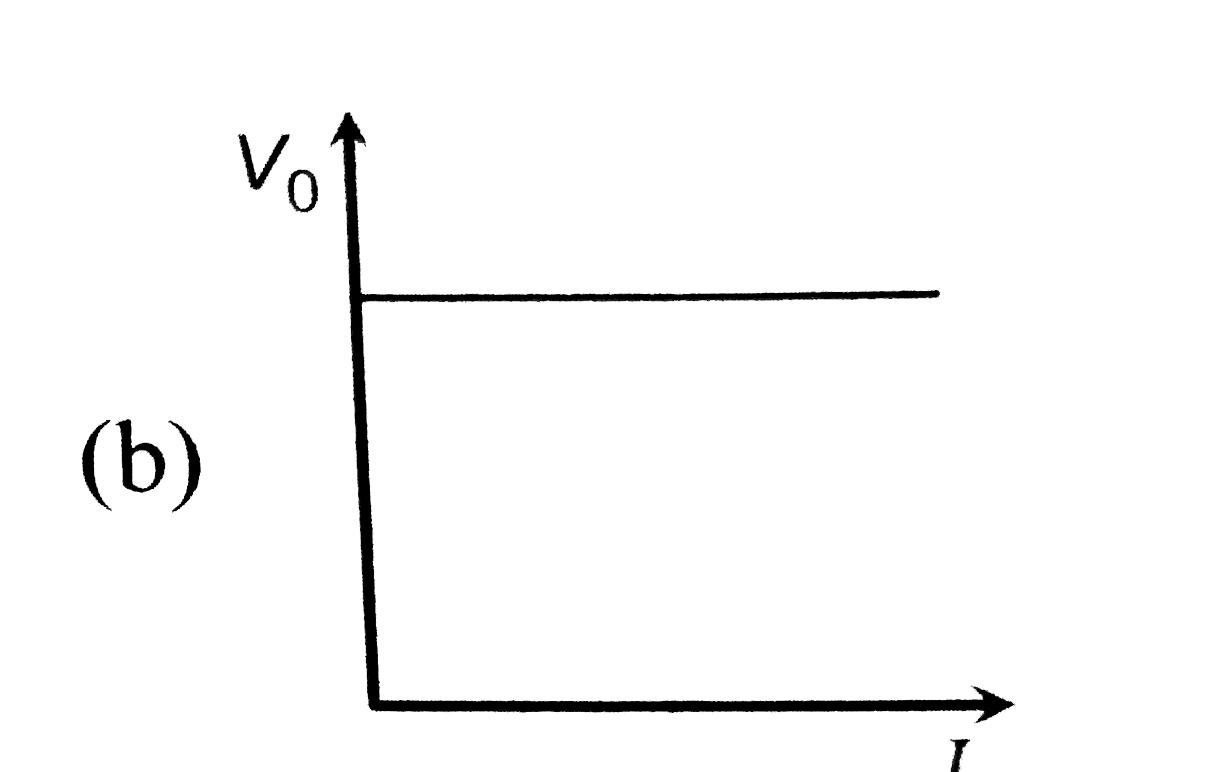 C
C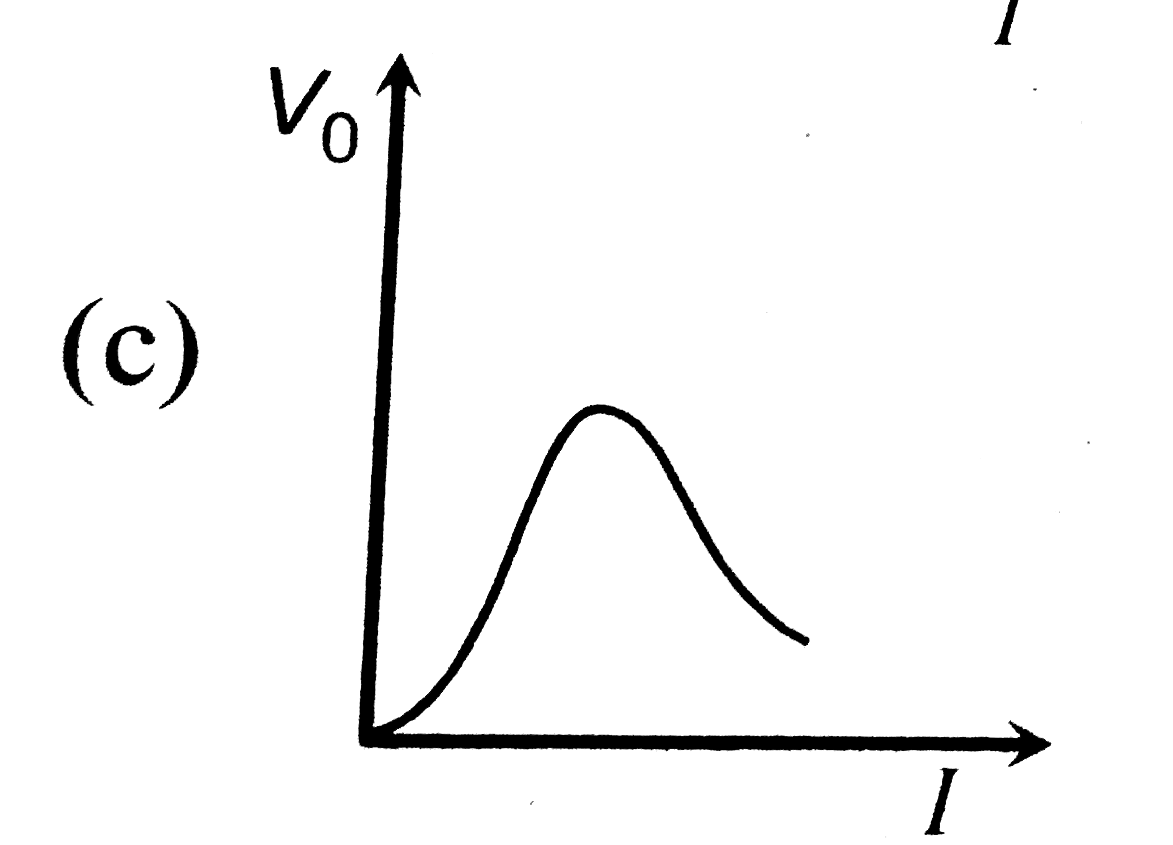 D
D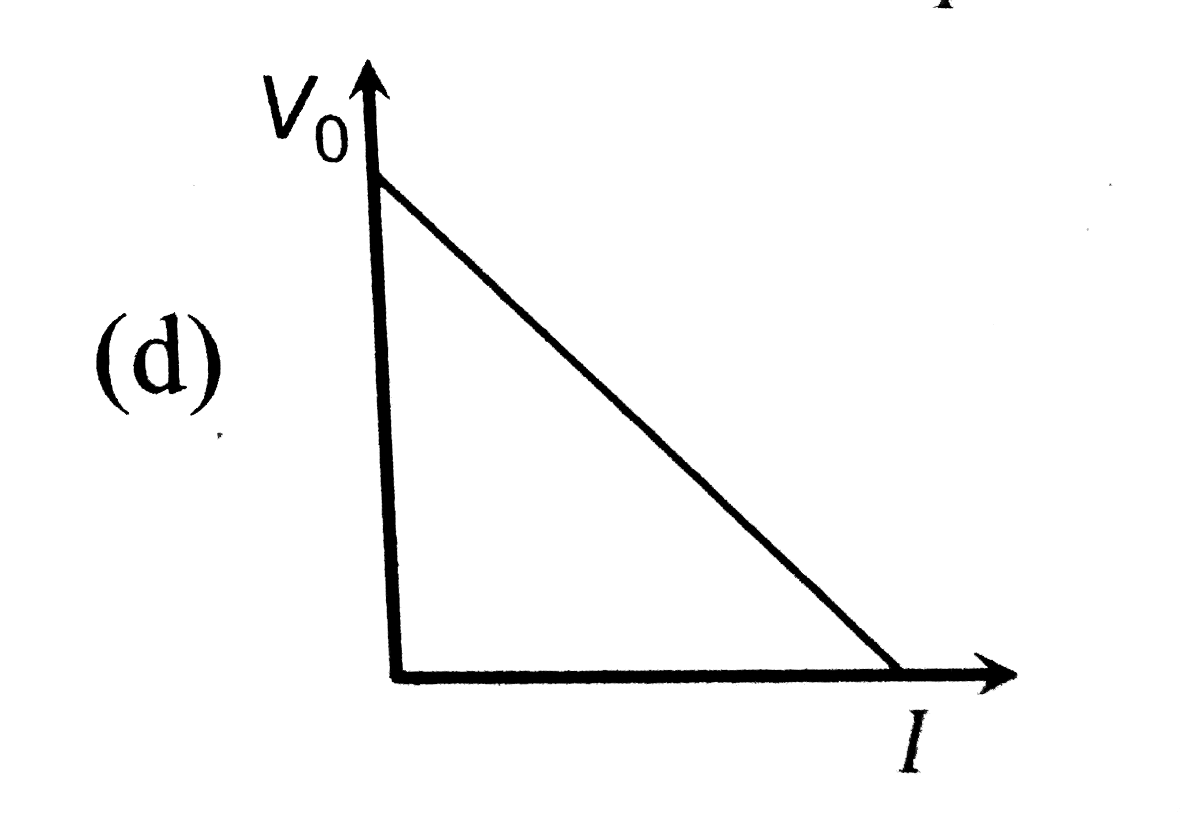
- Question 3 - Select One
In photoelectric effect the slope of stop of stopping potential versus frequency of incident light for a given surface will be
Ahe−1Be hCeDh
In a photoelectric experiment, two metal pairs plates A and B are used for a given light intensity I and frequency f. work function of metal B is more than that of A. The correct variation of stopping potential difference versus frequency is given by:
View SolutionDraw a plot showing the variation of photoelectric current with collector plate potential for two different frequenciesv1andv2(v1>v2) of incident radiation having the same intensity. In which case will the stopping potential be higher? Justify your answer.
View SolutionDraw suitable graphs to show the variation of photoelectric current with collector plate potential for
(i) a fixed frequency but different intensities I1>I2>I3 of radiation.
(ii) a fixed intensity but different frequencies v1>v2>v3 of radiation.View SolutionChoose the graph showing the correct relationship between the stopping potential V0 and the frequency v of light for potassium and tungsten.
View SolutionChoose the correct option for the graph between the frequency of incident light and the stopping potential.
View Solution

