The graphs show the concentration of glucose and insulin in the blood of healthy person. Which graph show she changes expected after a meal containing starch?
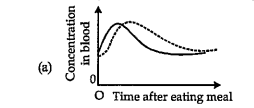
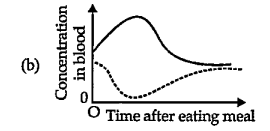
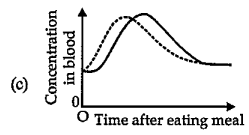
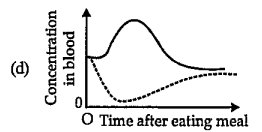
The correct Answer is:A
Similar Questions
Which graph shows zero activation energy ?
View SolutionThree of the graphs below show the absortion spectra of photosynthetic pigments. One graph shows the action spectrum of p'hotosynthesis for a plant containing the pigments.
All the x axis show wavelength. Three of the y axis show light absorption. One y axis shows the rate of photosynthesis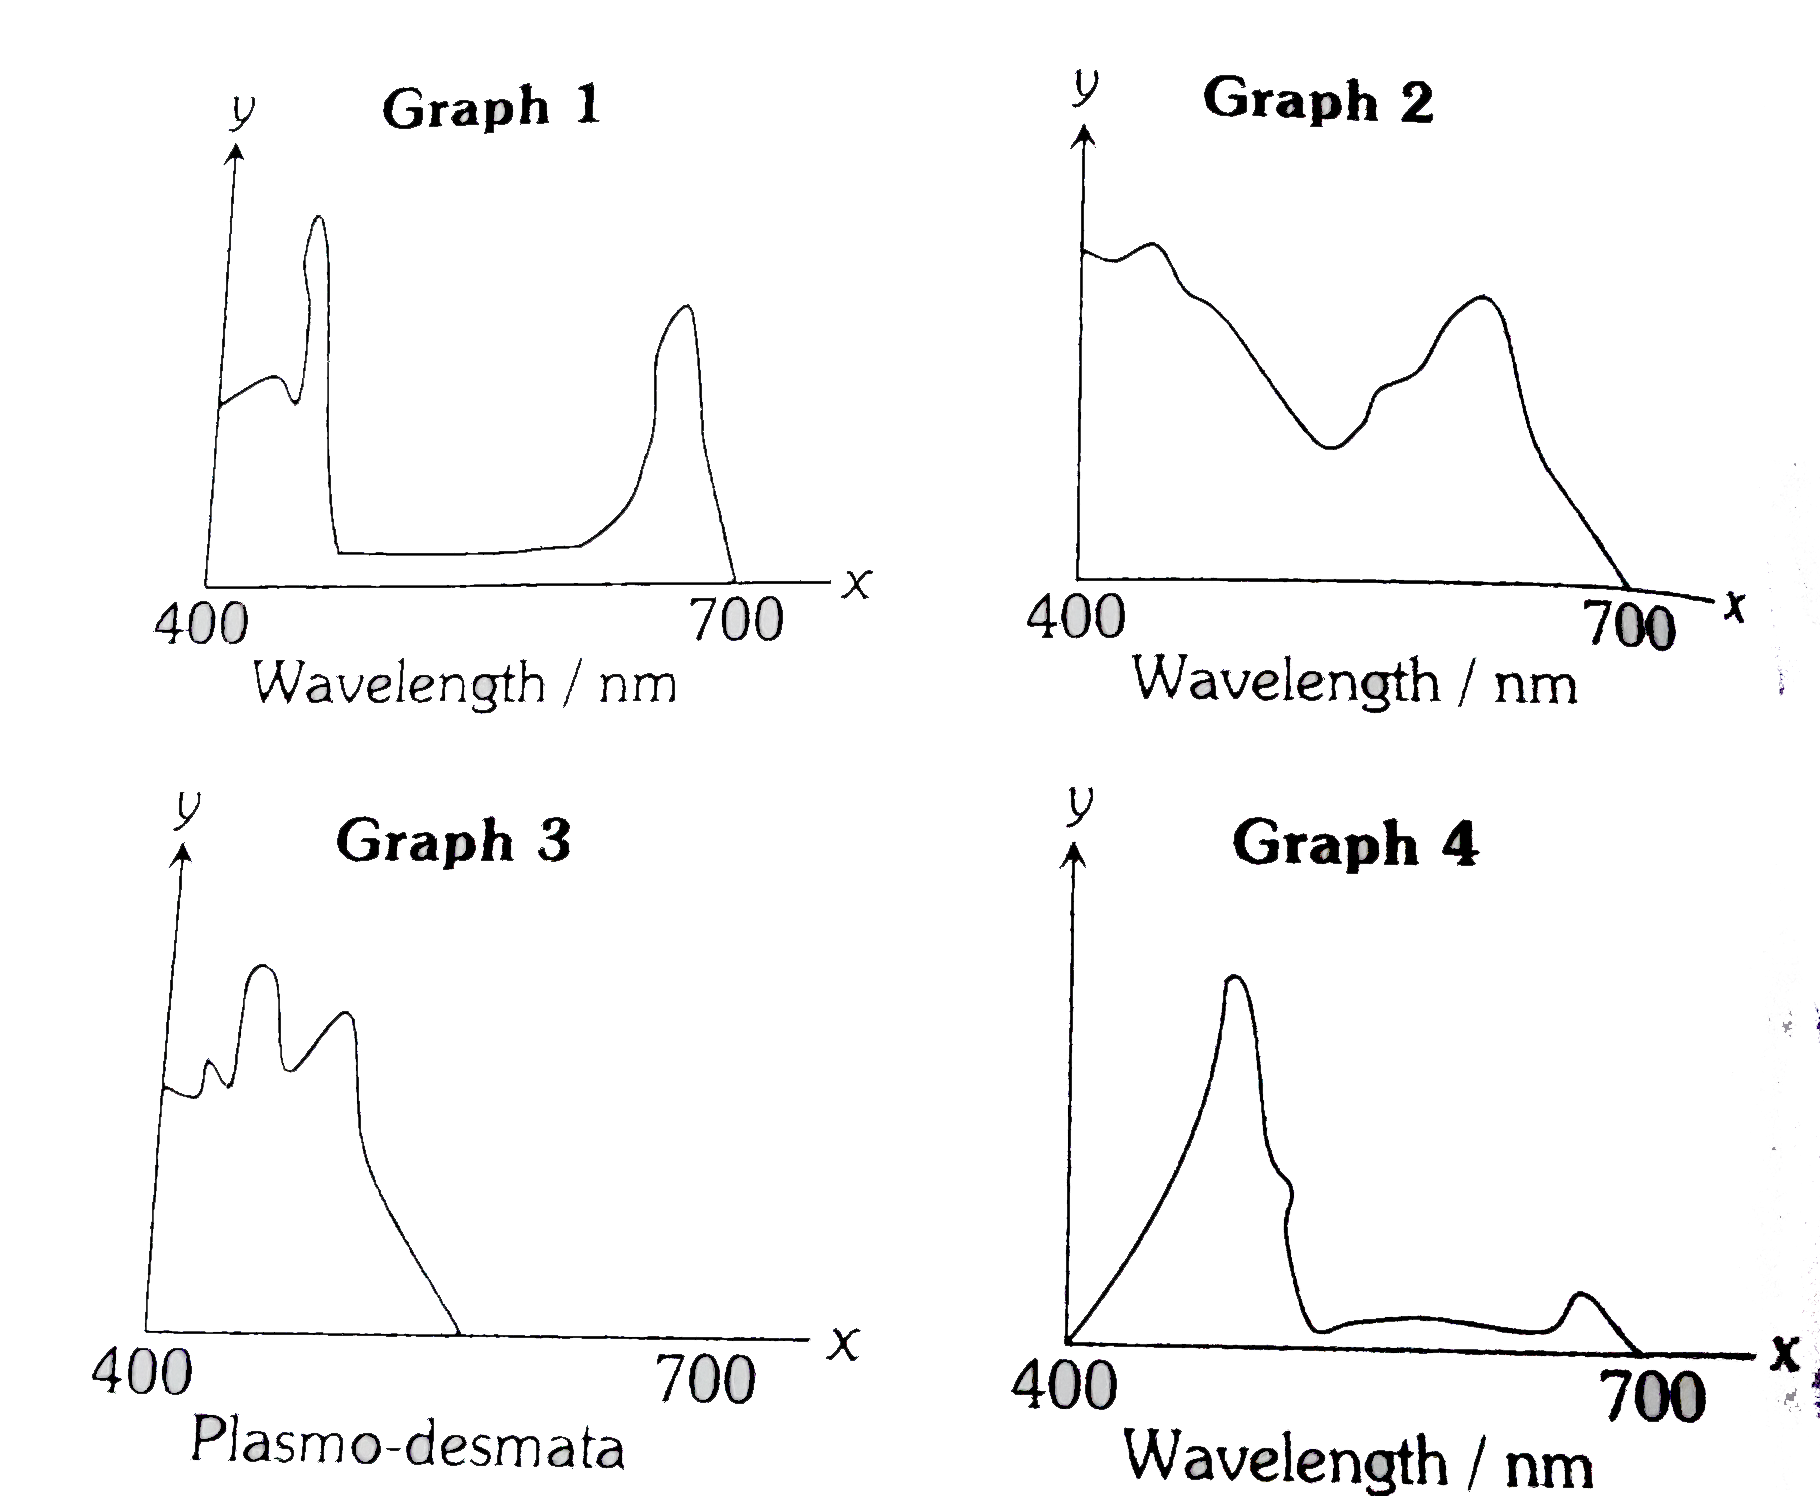

View Solution
Knowledge Check
Which graph shows zero activation energy ?
A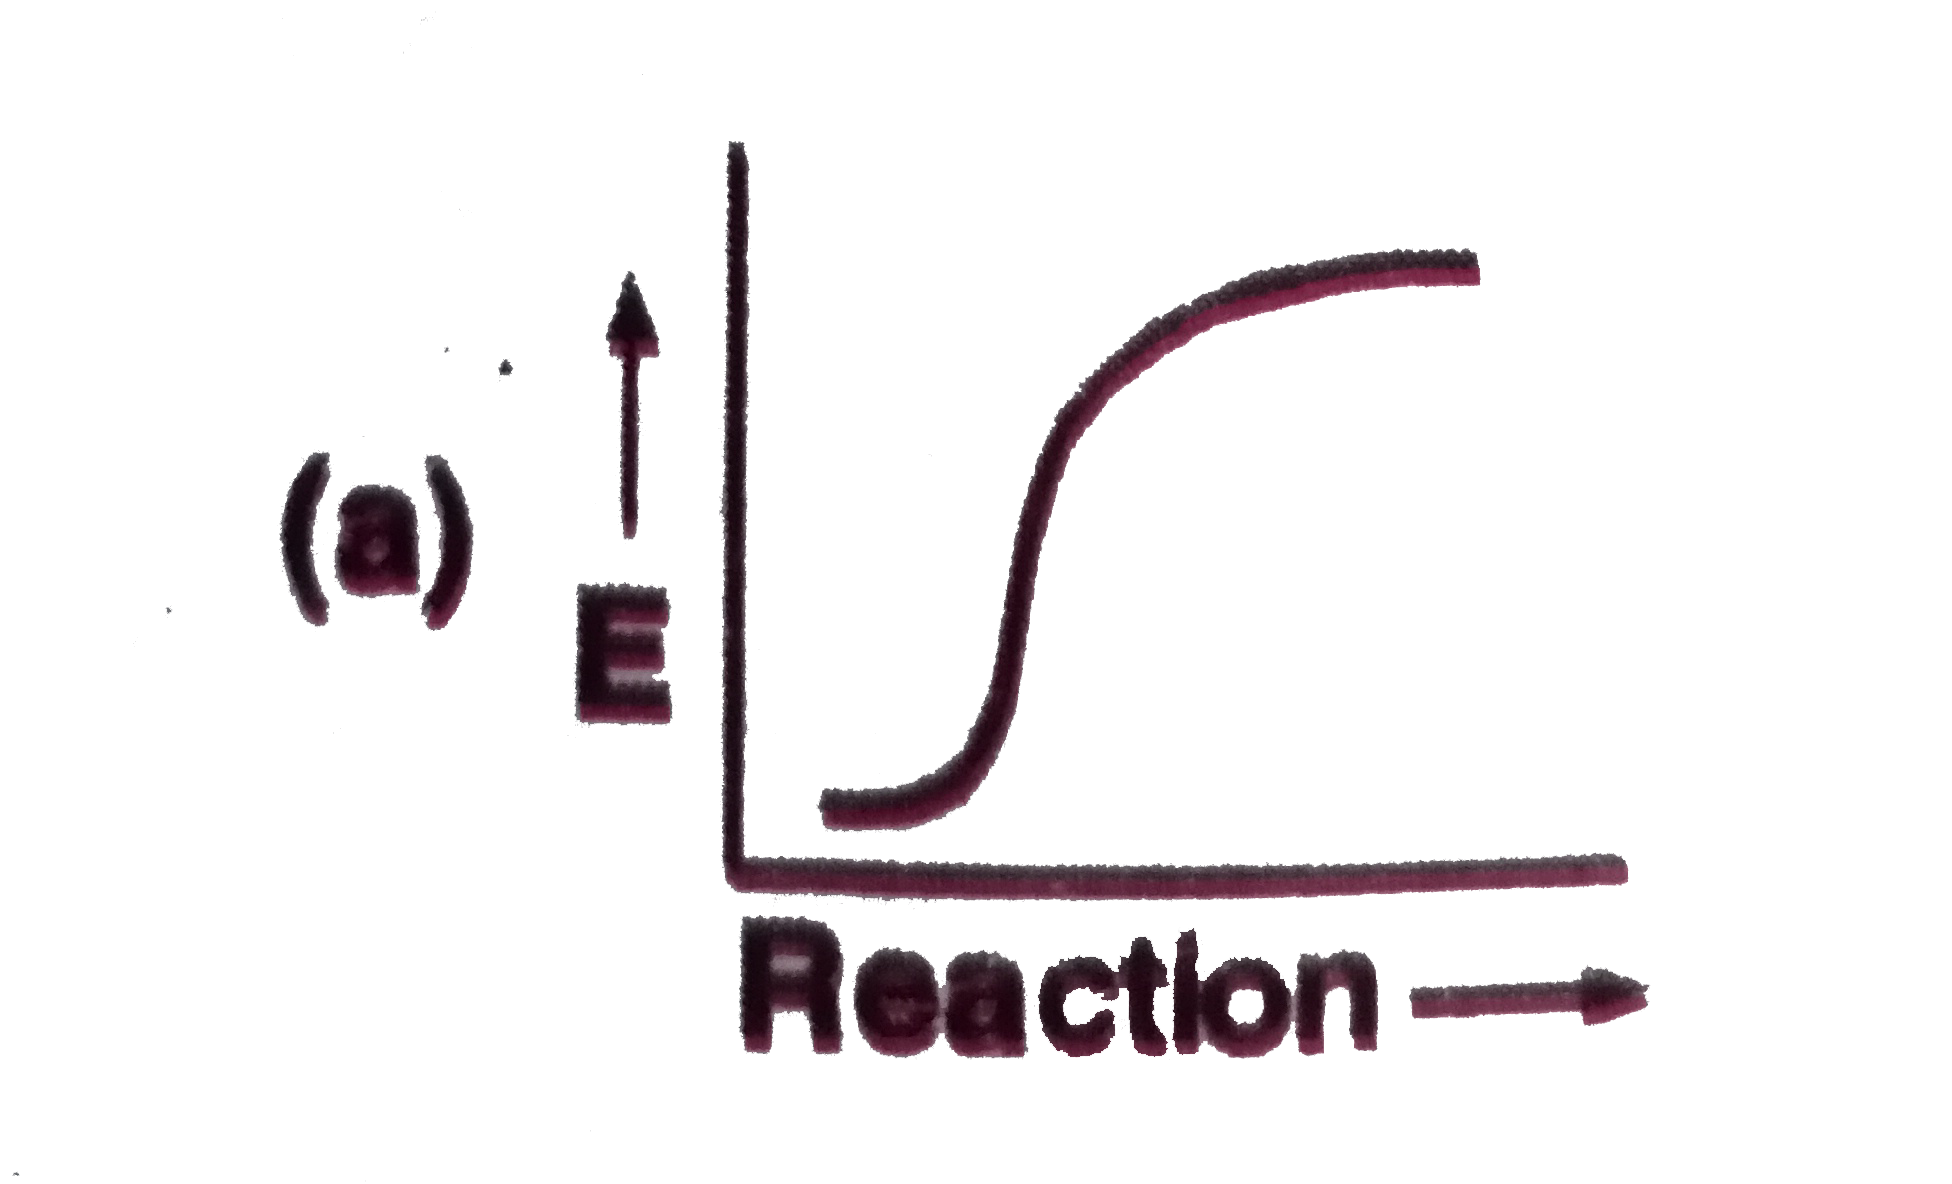 B
B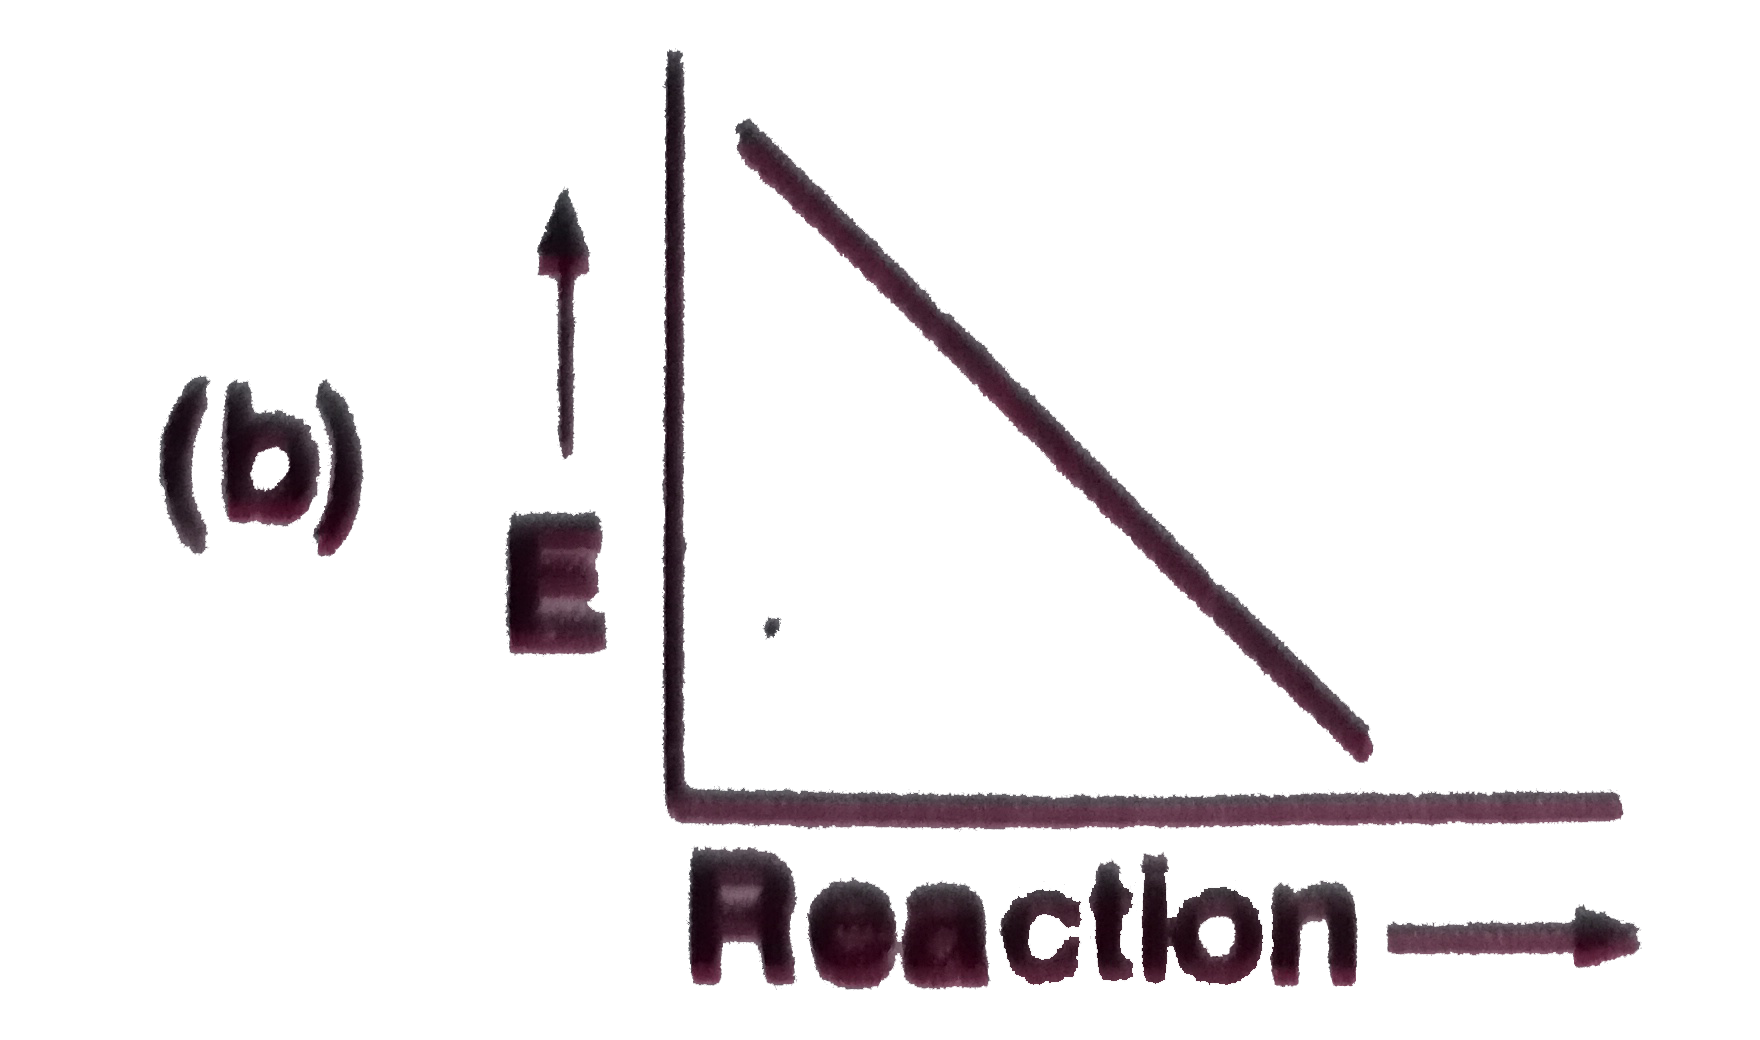 C
C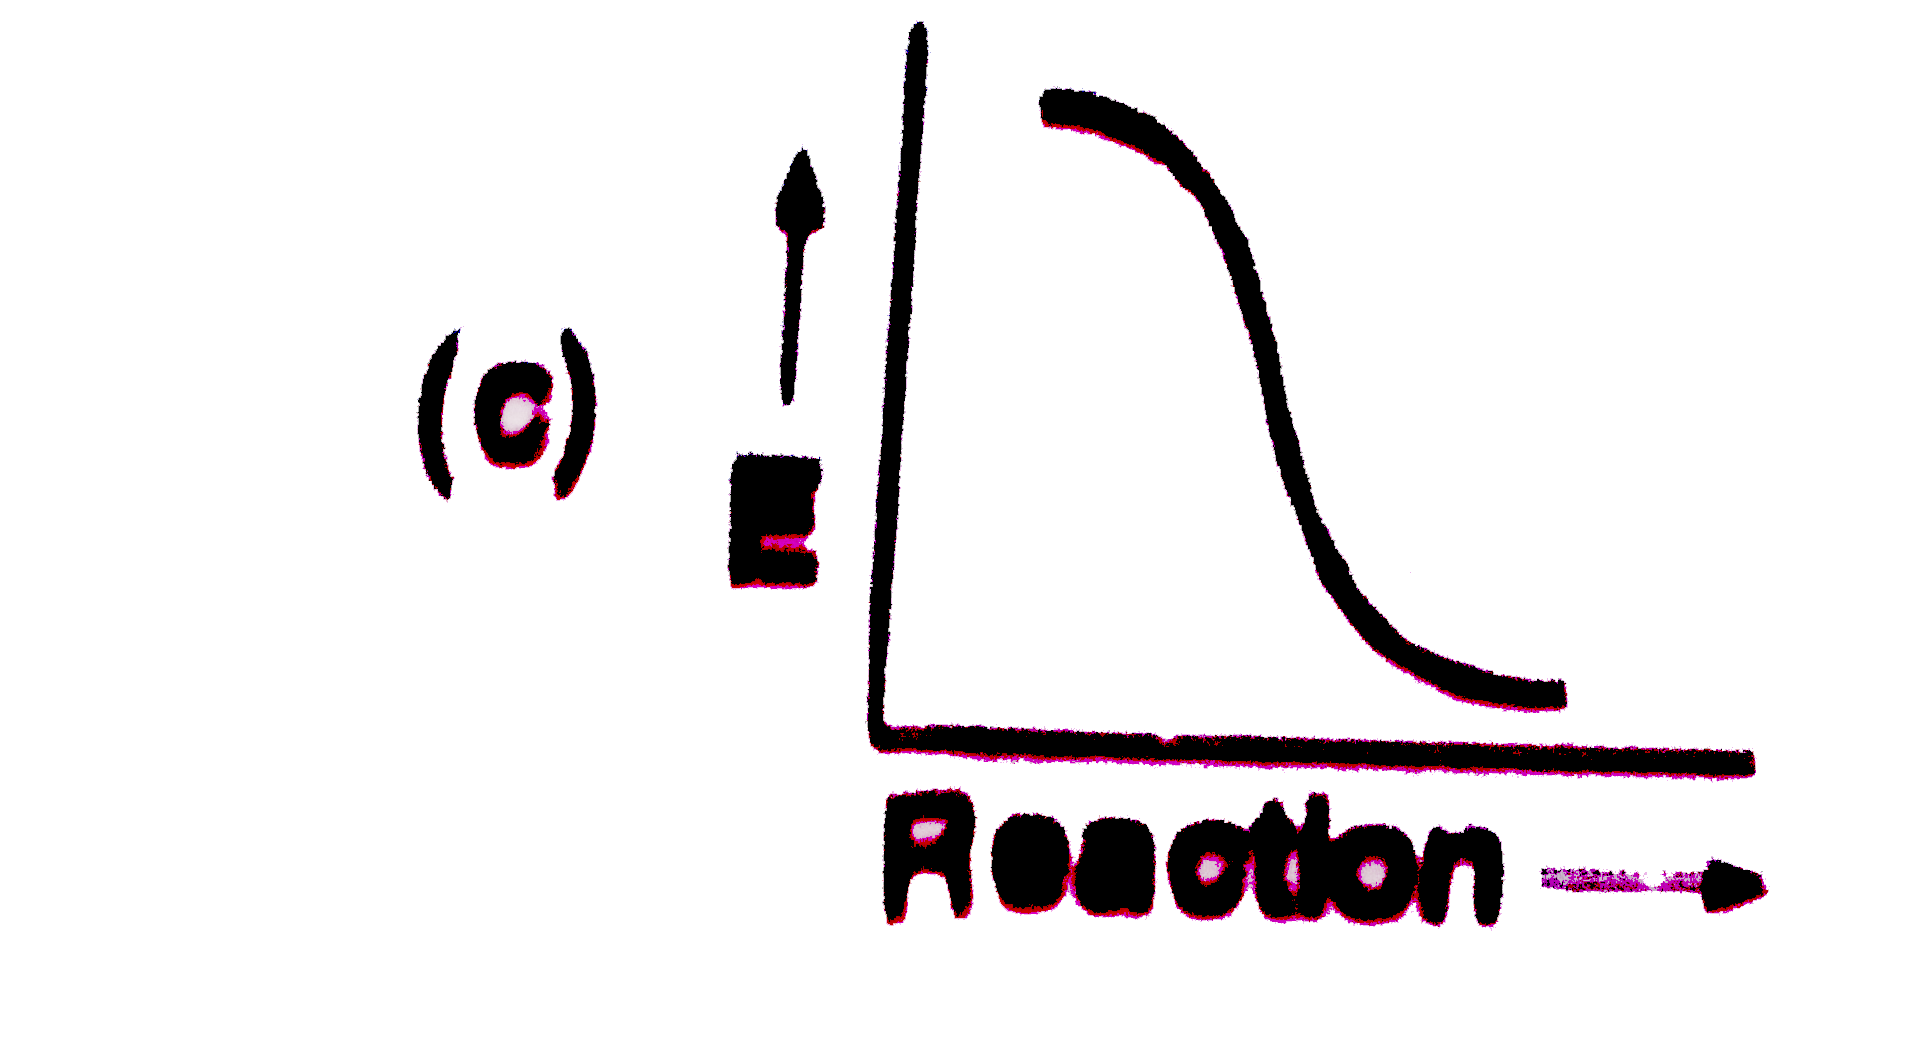 D
D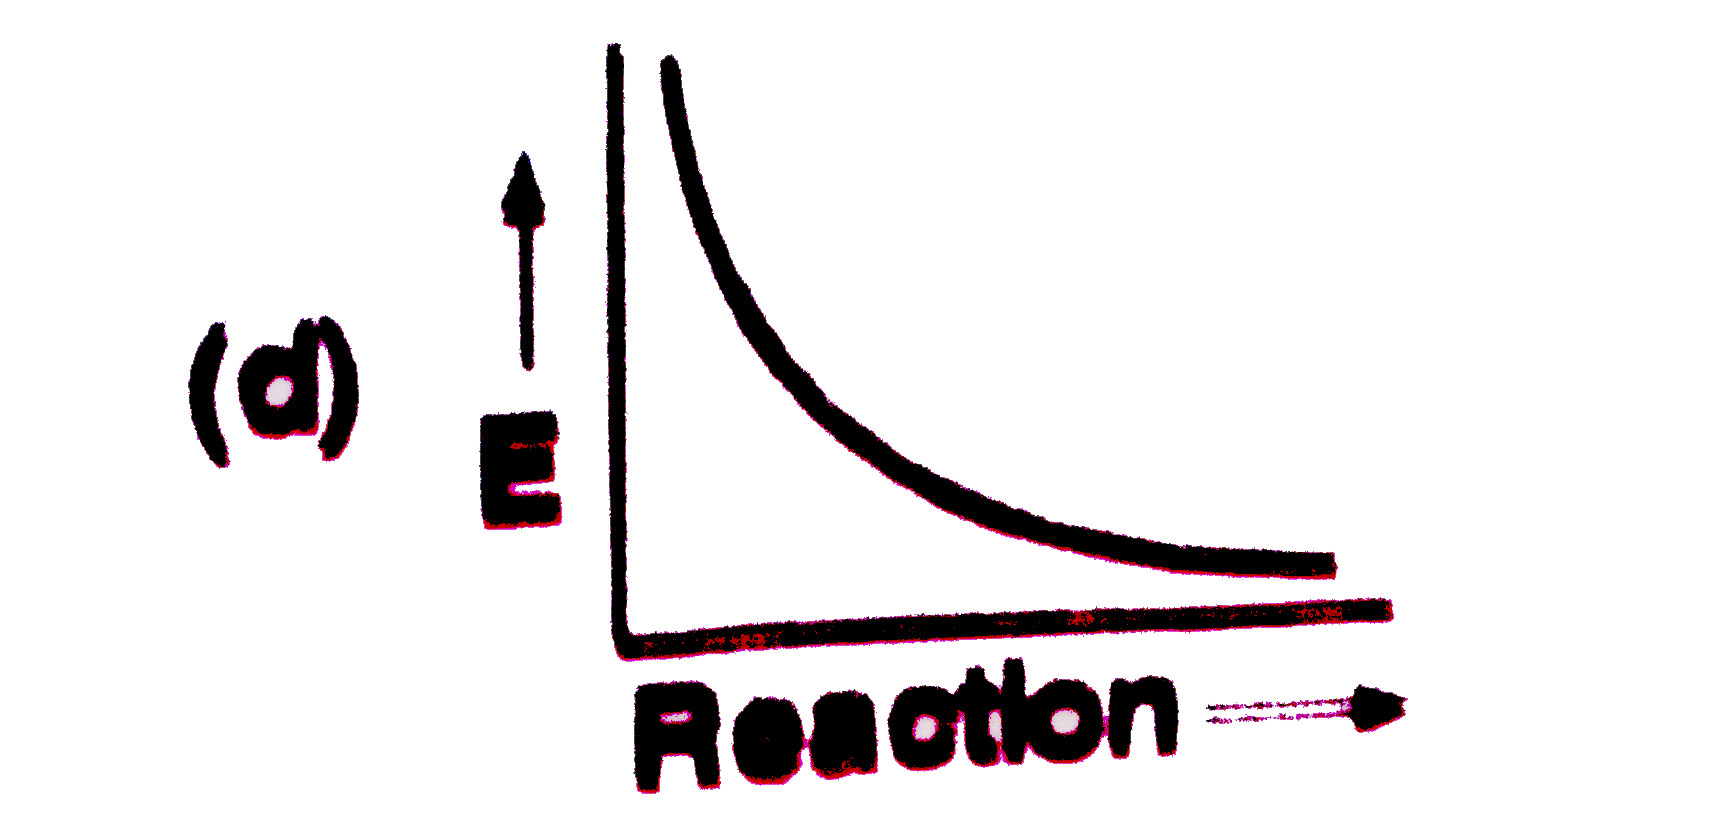
Which of the graph shows that the particle is at rest .
A B
B C
C D
D
The graph shows the effect of liver and kidneys in dogs on the amount of urea in the blood. On the graph, two marks O and X shows the time when these two organs were removed . Which mark shows the removal of which organ ?
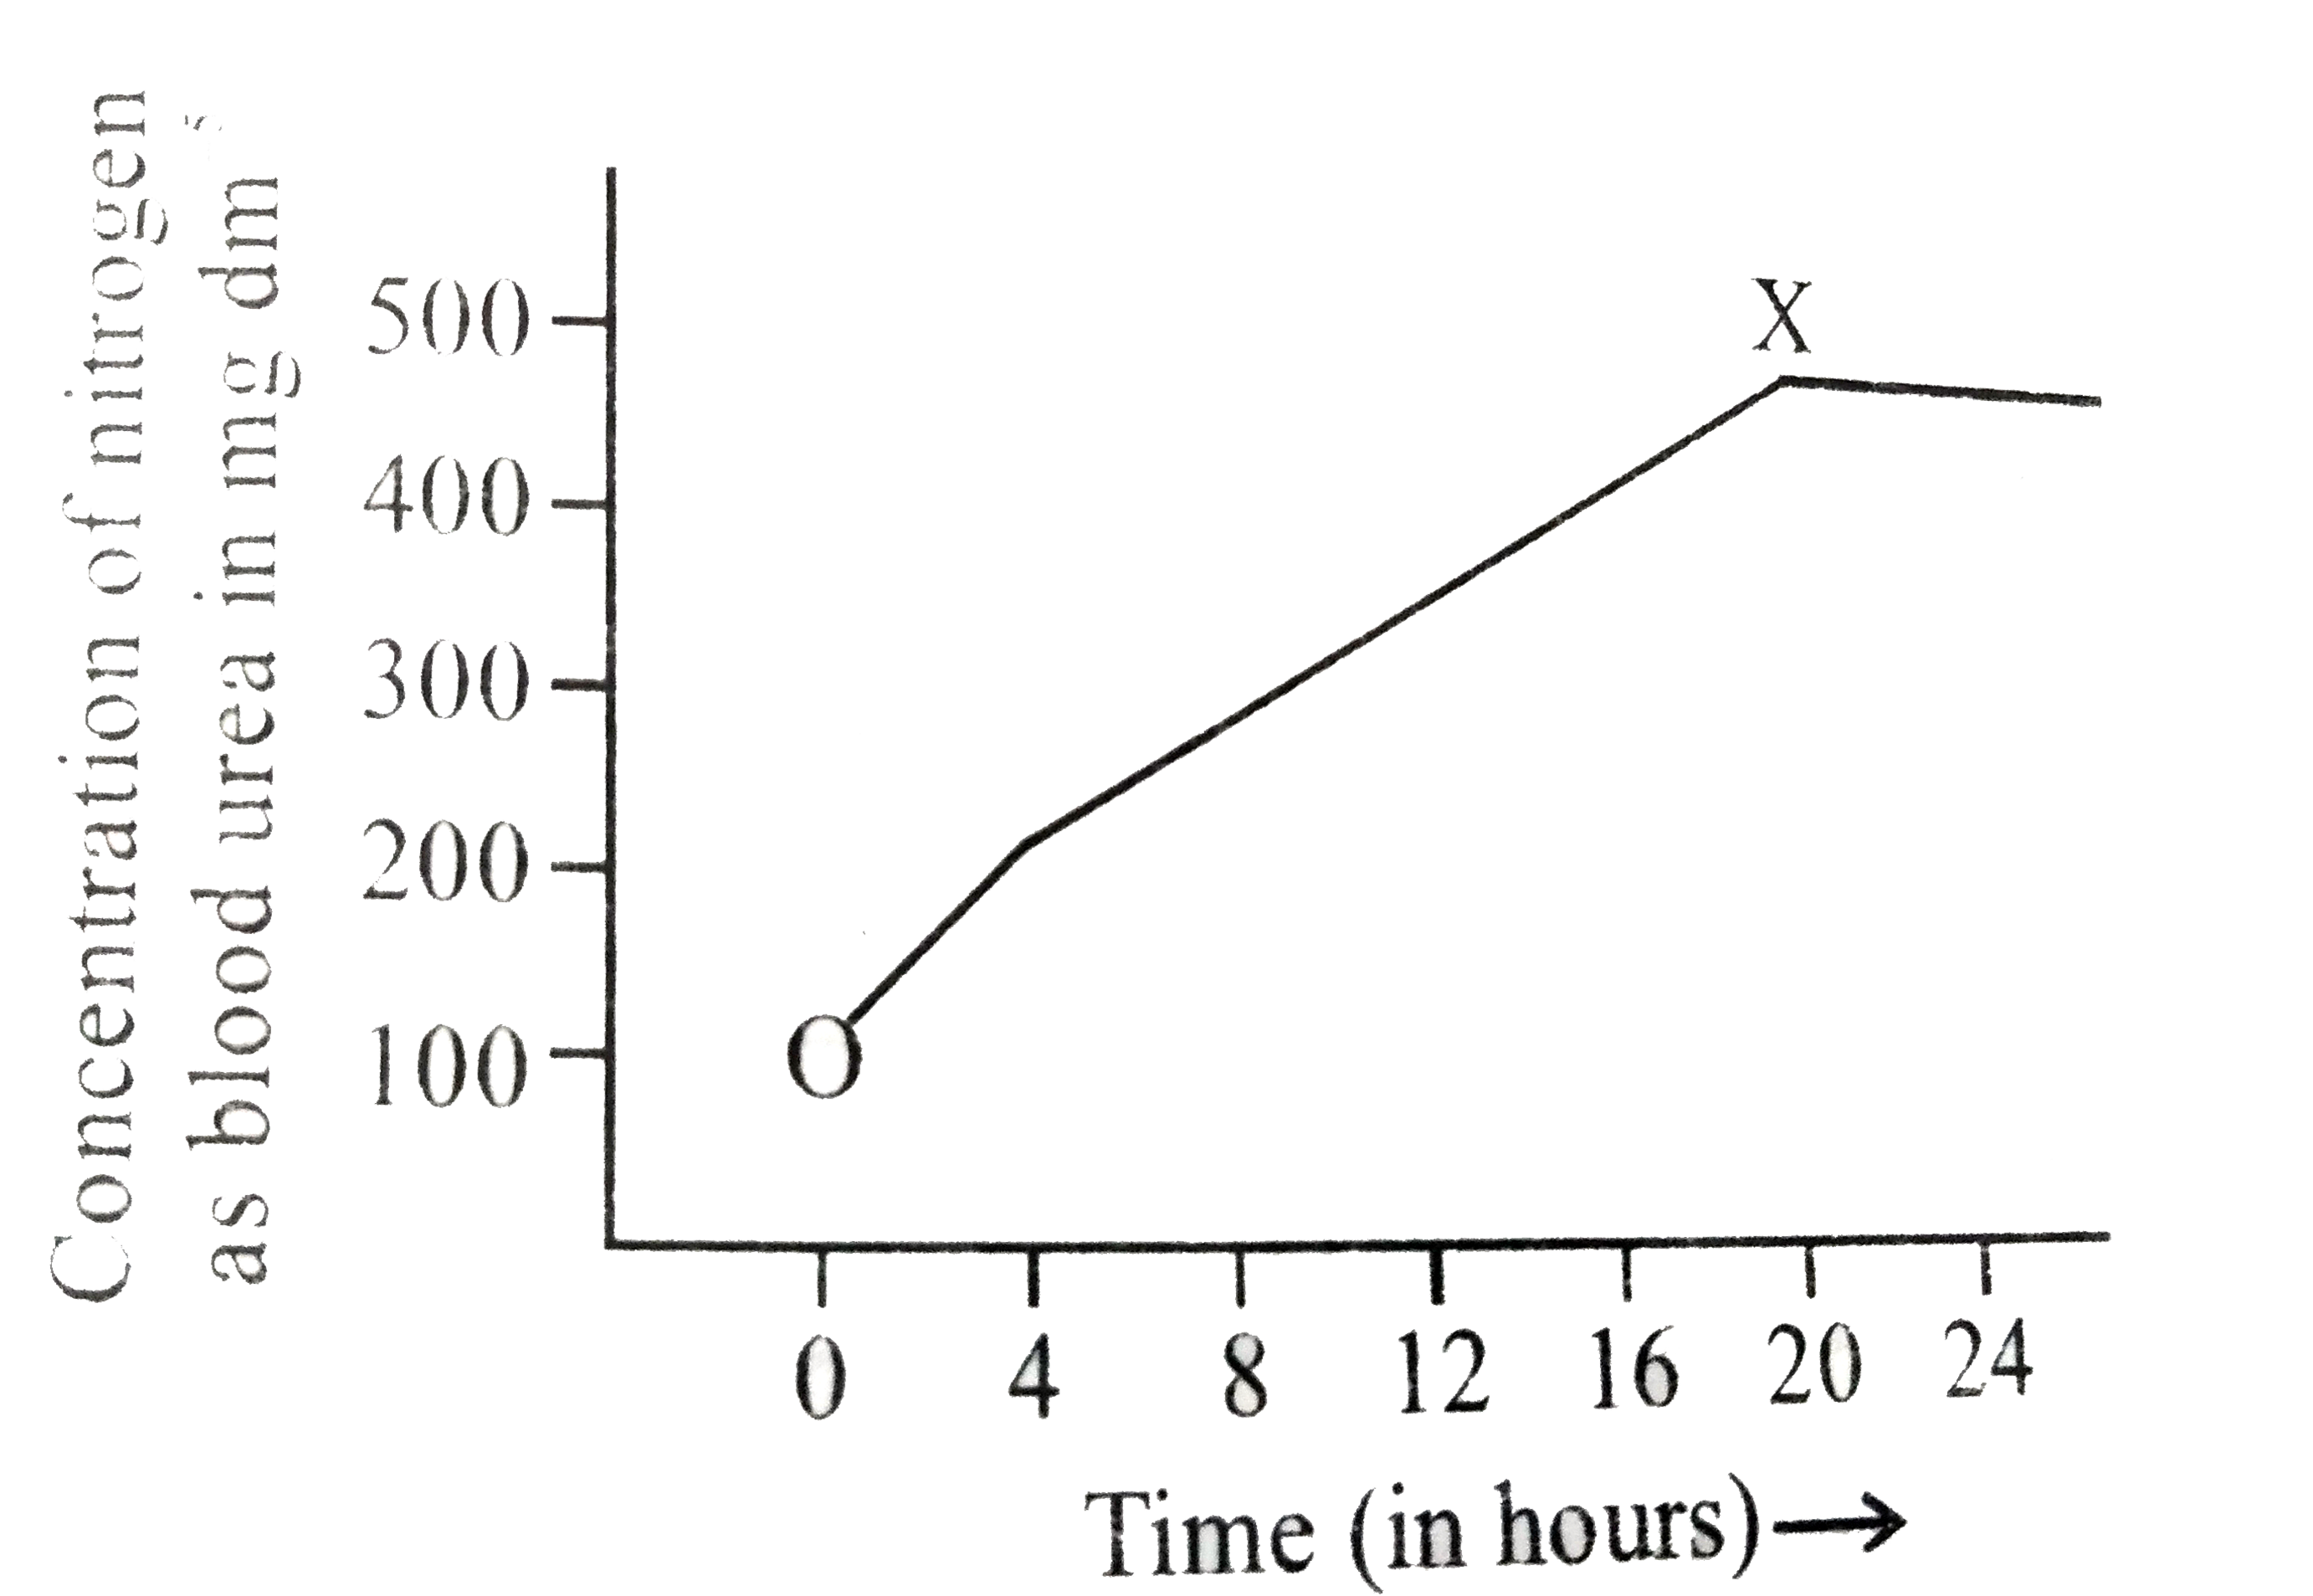 AO' stands for removal of liver and 'X' for the removal of kidneyBO' stands for the removal of kidney and 'X' for the removal of liver.CThe given data is incomplete.DAny of the mark can be taken as the time of removal of kidney or the liver
The graph shows the effect of liver and kidneys in dogs on the amount of urea in the blood. On the graph, two marks O and X shows the time when these two organs were removed . Which mark shows the removal of which organ ?

View SolutionThe graph below shows the changes in two populations of herbivores in a grassy field. A possible reason for these changes is that

View SolutionWhich blood vessel will contain a high amount of glucose and amino acids after a meal
View SolutionWhich of the graph shows a particle with retardation?
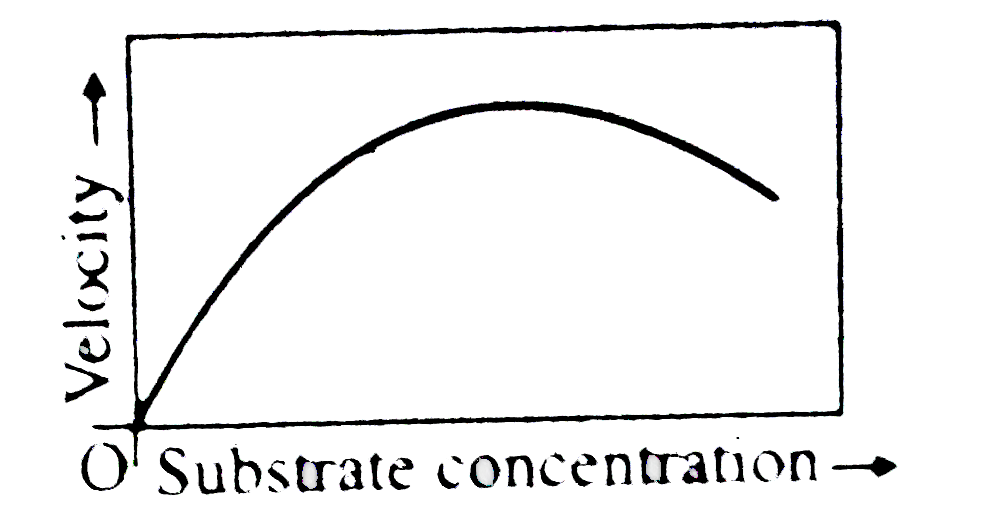
View SolutionThe given graph shows the effect of substrate concentration on the rate of reaction of the enzymes green gram-phosphatase. What does the graph indicate ?
View Solution
