The graph shows the effect of liver and kidneys in dogs on the amount of urea in the blood. On the graph, two marks O and X shows the time when these two organs were removed . Which mark shows the removal of which organ ?
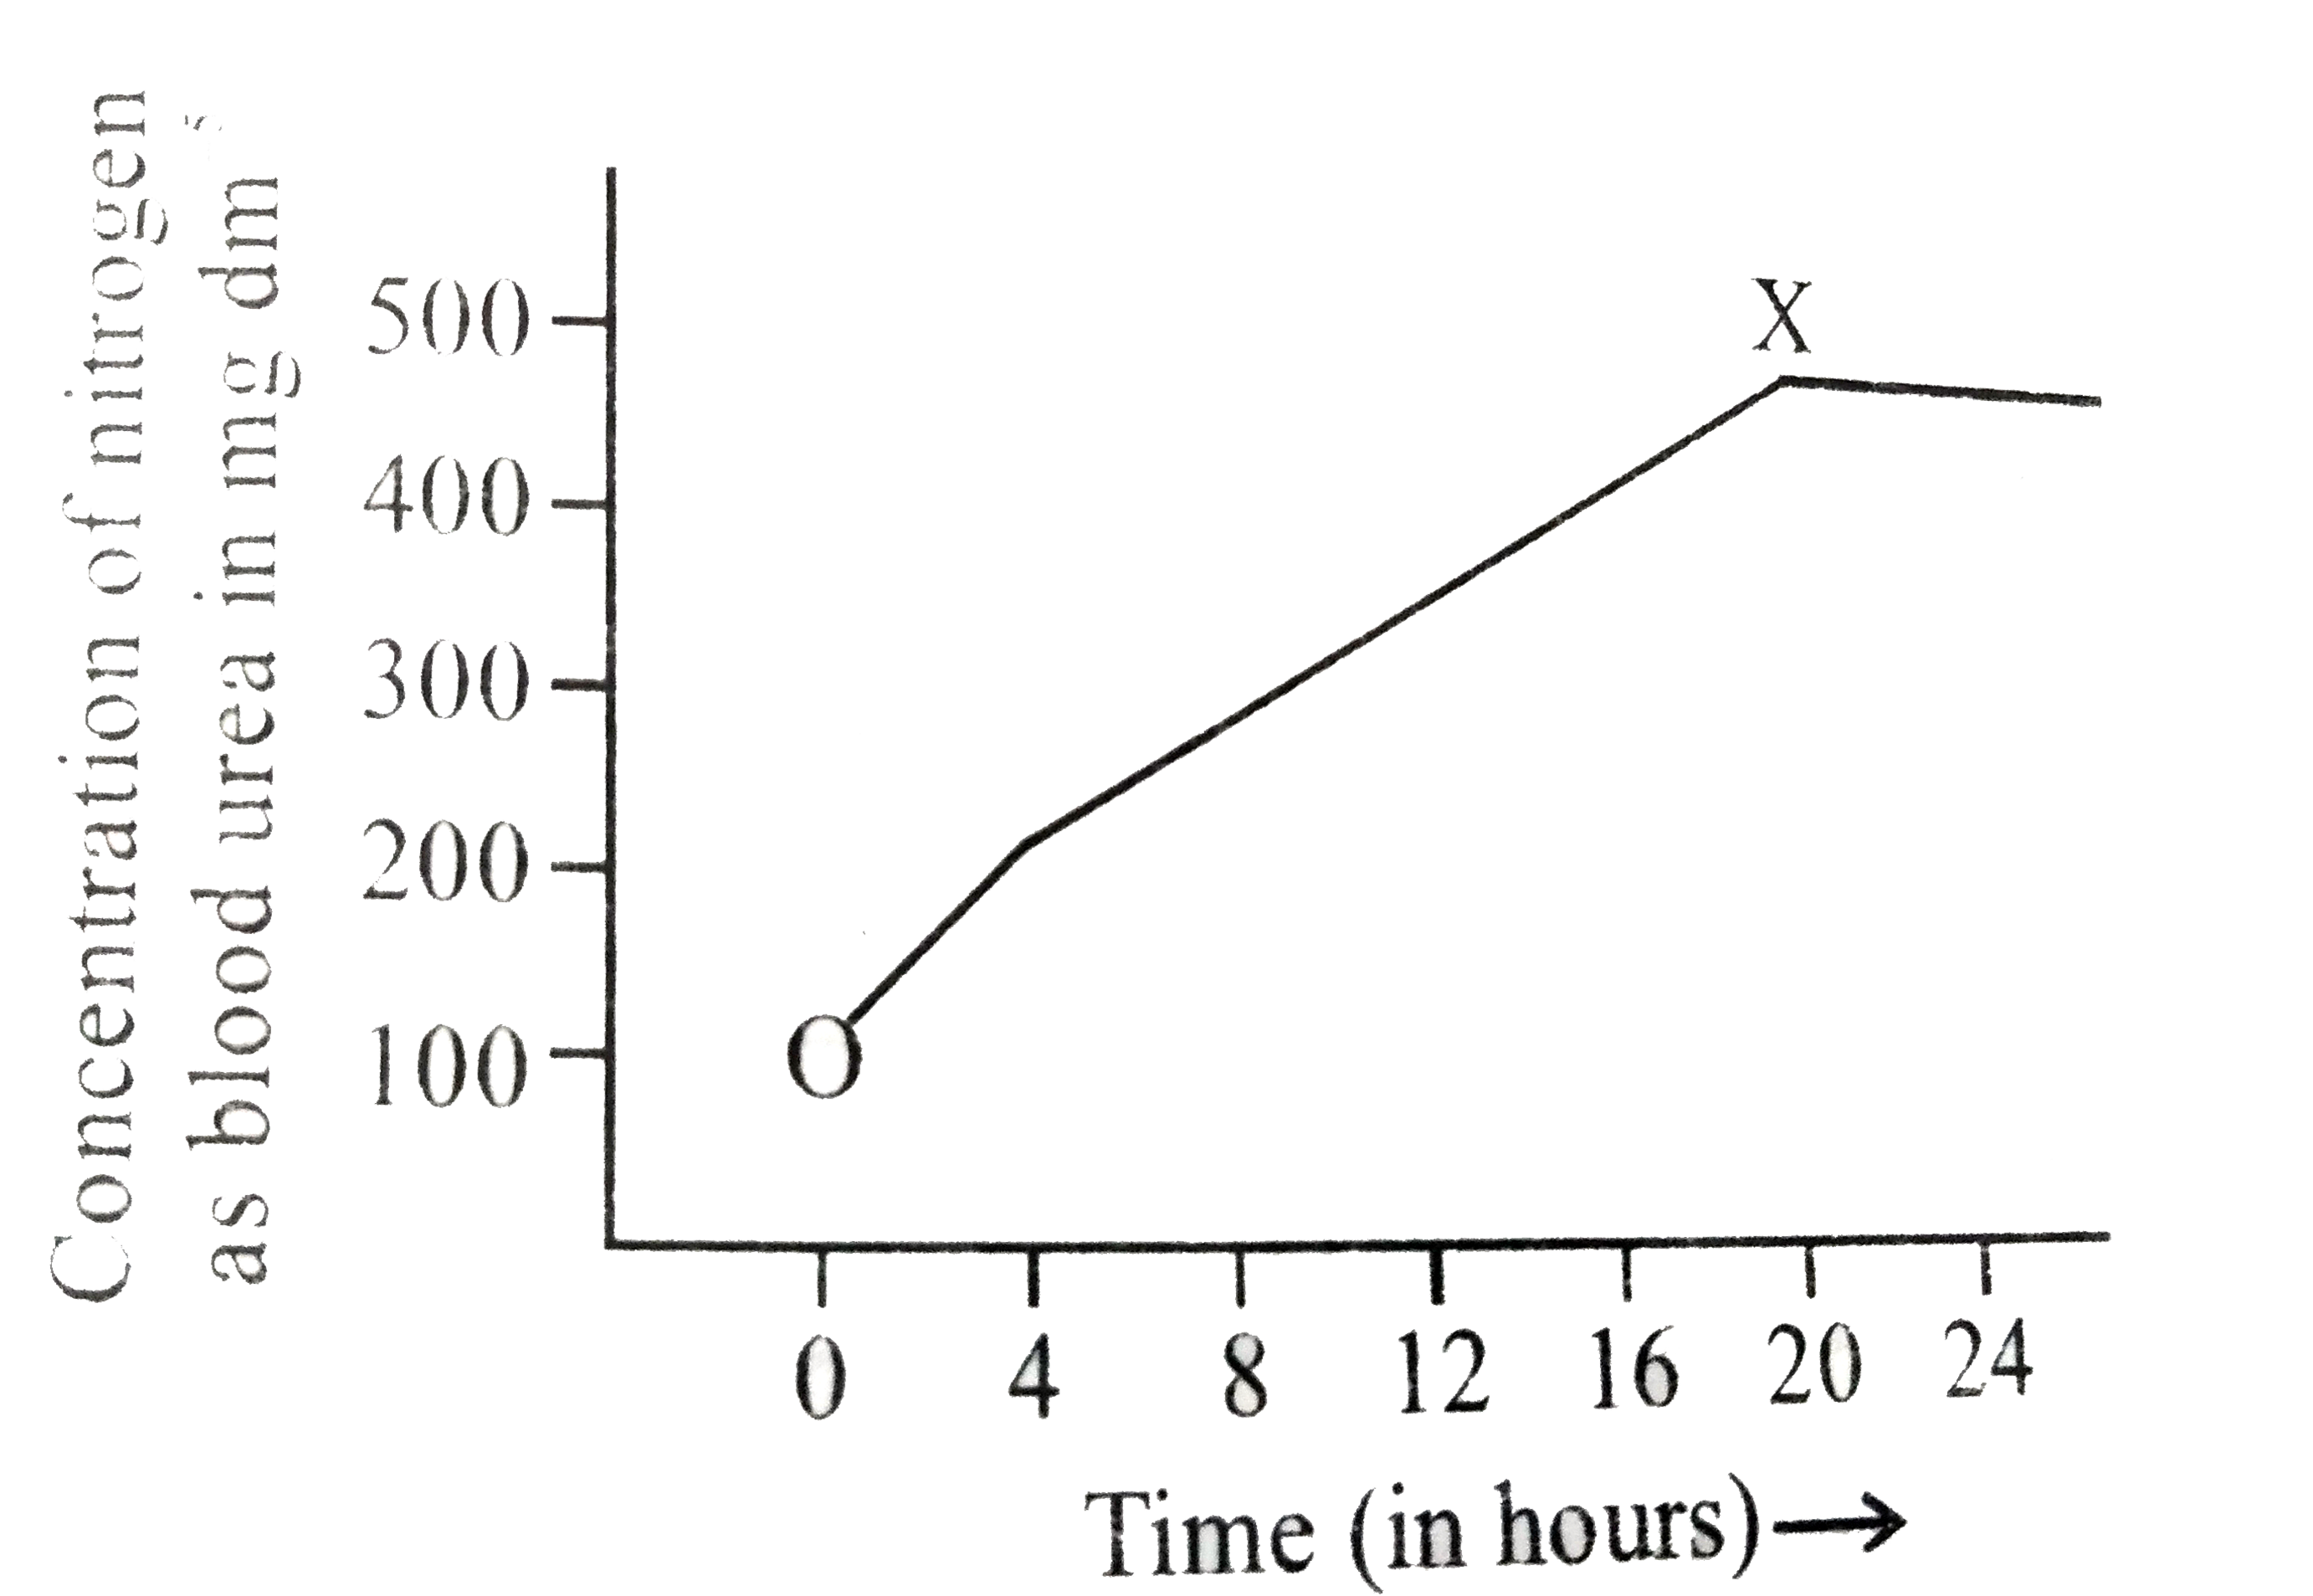
O' stands for removal of liver and 'X' for the removal of kidney
O' stands for the removal of kidney and 'X' for the removal of liver.
The given data is incomplete.
Any of the mark can be taken as the time of removal of kidney or the liver
The correct Answer is:1
Step by step video & image solution for The graph shows the effect of liver and kidneys in dogs on the amount of urea in the blood. On the graph, two marks O and X shows the time when these two organs were removed . Which mark shows the removal of which organ ? by Biology experts to help you in doubts & scoring excellent marks in Class 12 exams.
Updated on:21/07/2023Topper's Solved these Questions
- HUMAN PHYSIOLOGY -IBOOK - ALLENCHAPTER - HUMAN PHYSIOLOGY -IEXERCISE - BEGINNERS BOX-21
1 Videos
- HUMAN PHYSIOLOGY -IBOOK - ALLENCHAPTER - HUMAN PHYSIOLOGY -IEXERCISE - BEGINNERS BOX-22
1 Videos
- HUMAN PHYSIOLOGY -IBOOK - ALLENCHAPTER - HUMAN PHYSIOLOGY -IEXERCISE - EXERCISE-III A. NCERT BASED QUESTIONS
17 Videos
- HUMAN HEALTH AND DISEASEBOOK - ALLENCHAPTER - HUMAN HEALTH AND DISEASEEXERCISE - Question
116 Videos
- HUMAN REPRODUCTION BOOK - ALLENCHAPTER - HUMAN REPRODUCTION EXERCISE - Question
92 Videos
Similar Questions
Knowledge Check
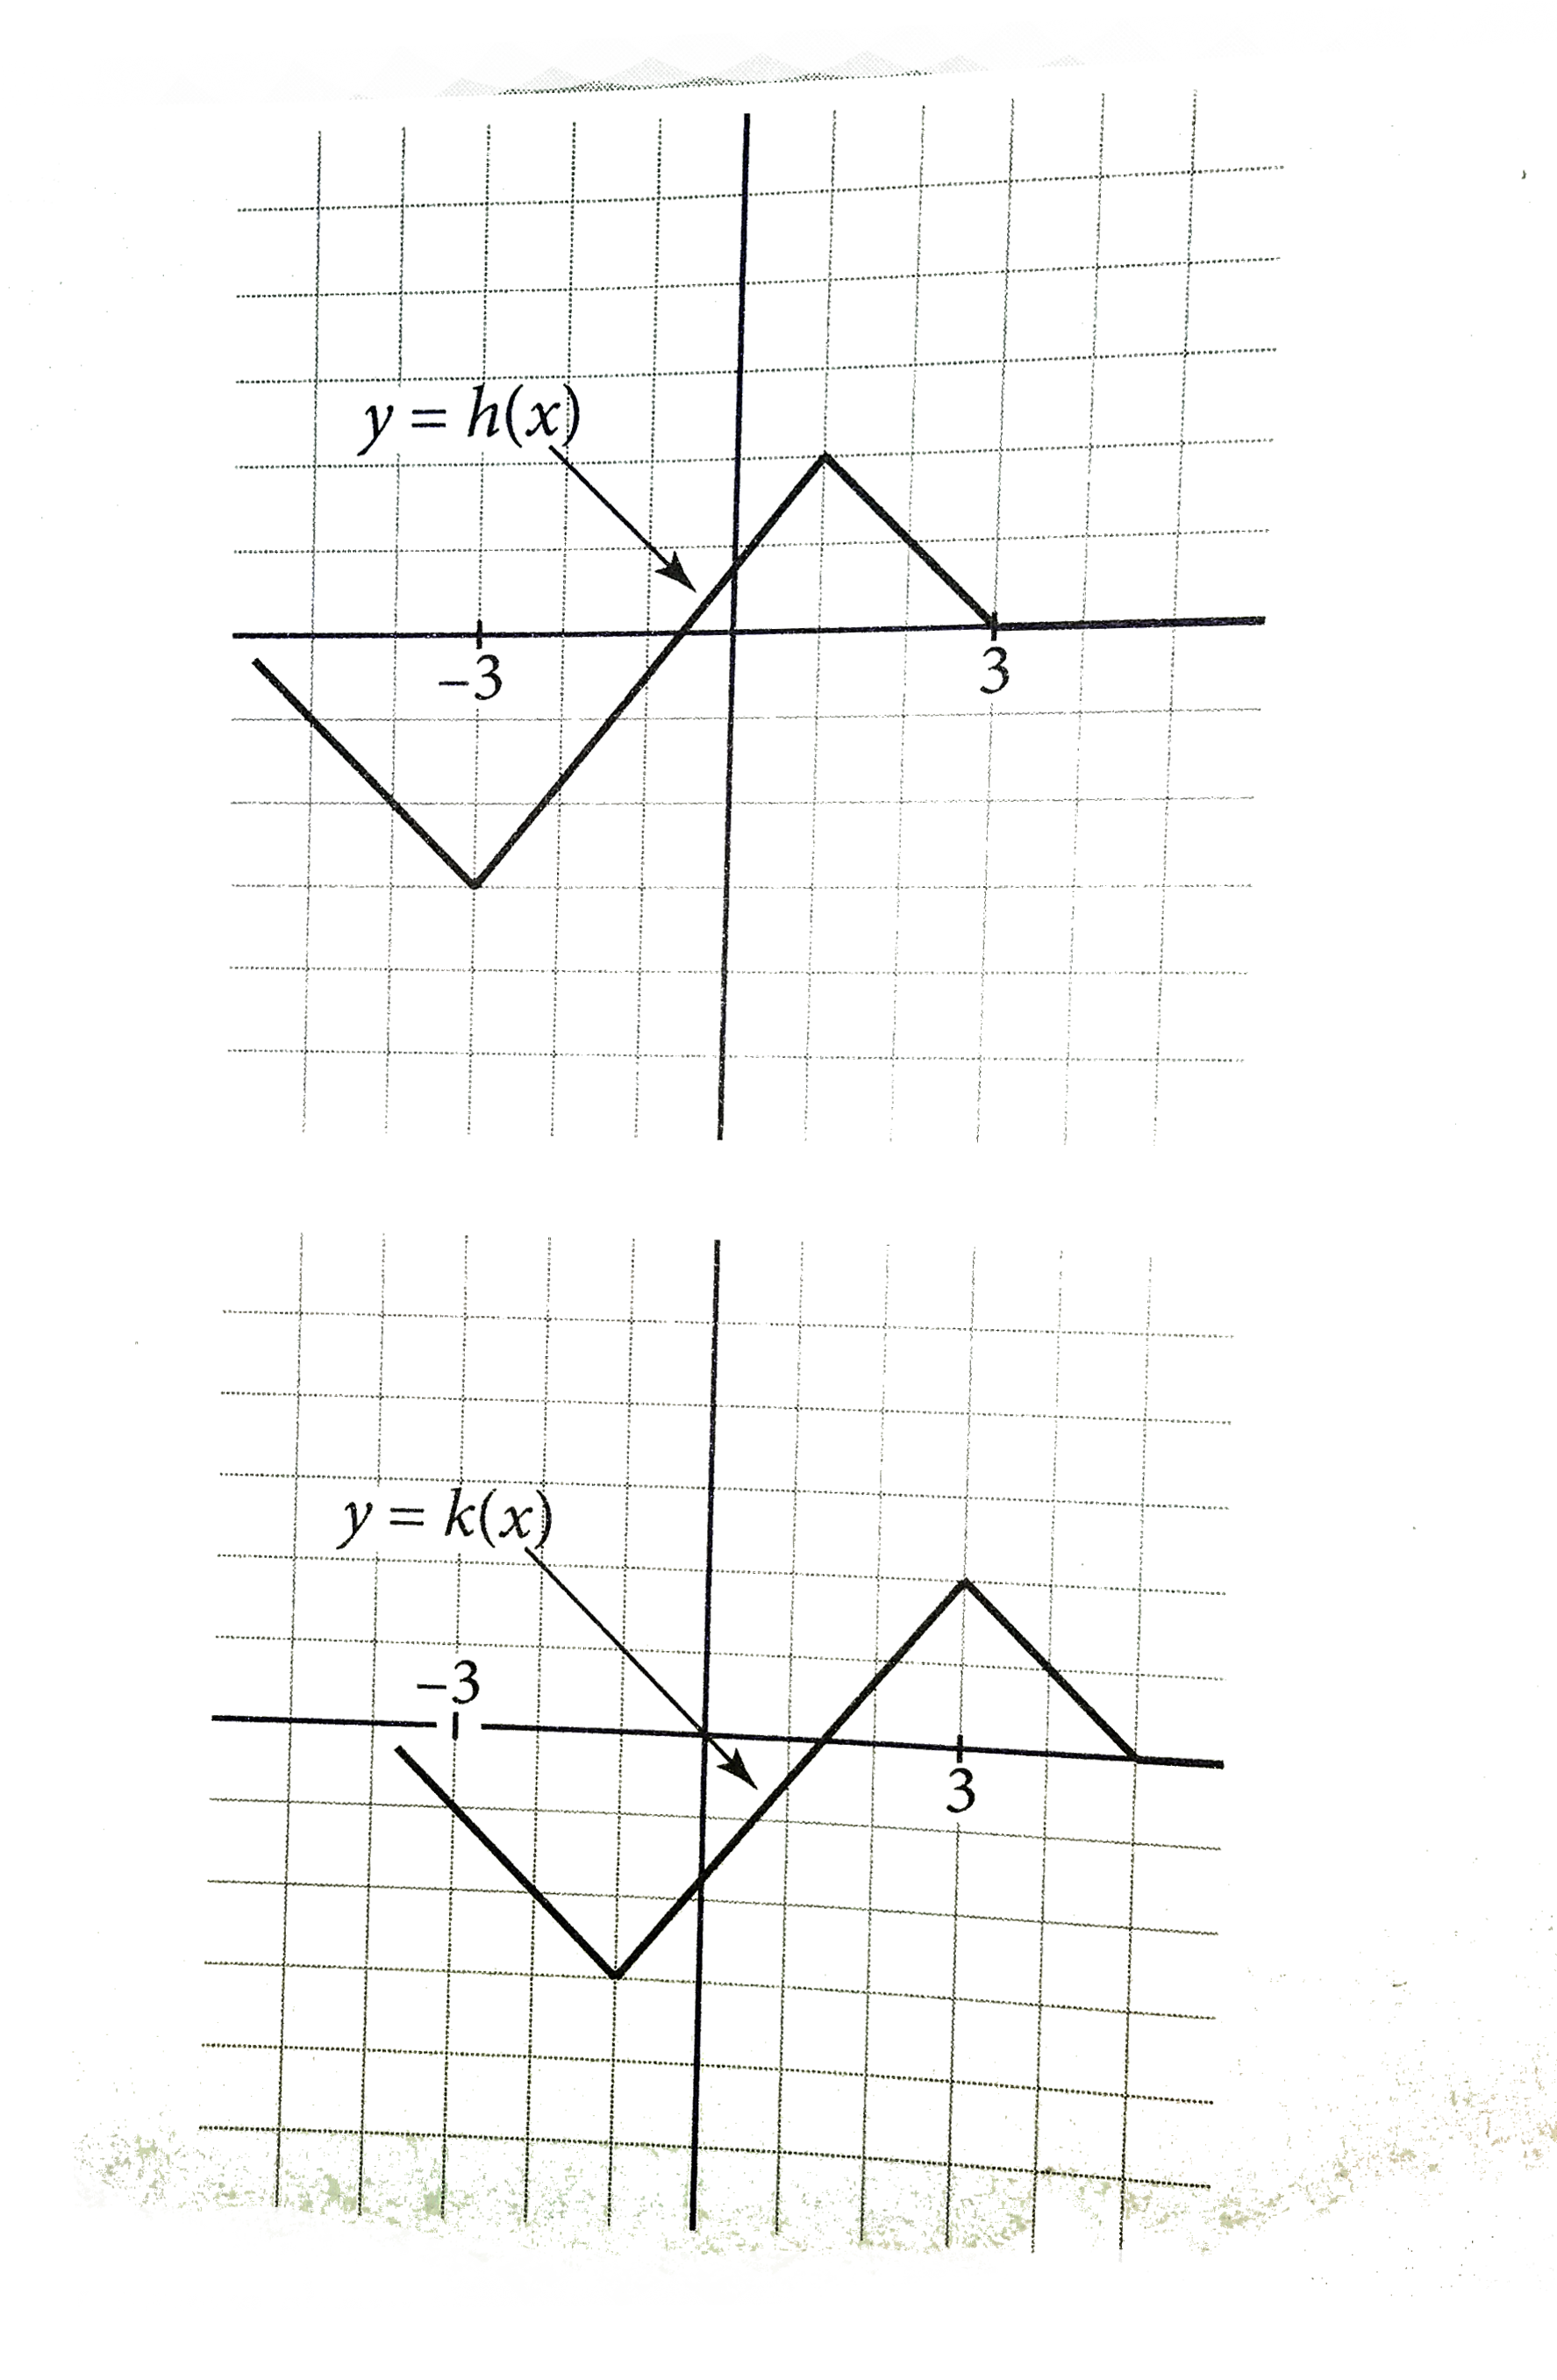
The graphs above show the complete functions h and k. which one of the following expresses k(x) in terms of h(x)?Ak(x)=h(x)+2Bk(x)=h(x)−2Ck(x)=h(x+2)Dk(x)=h(x−2)
The graph between the current and the time for an inductance coil is shown below. Which of the following graph show the voltage-time variation-
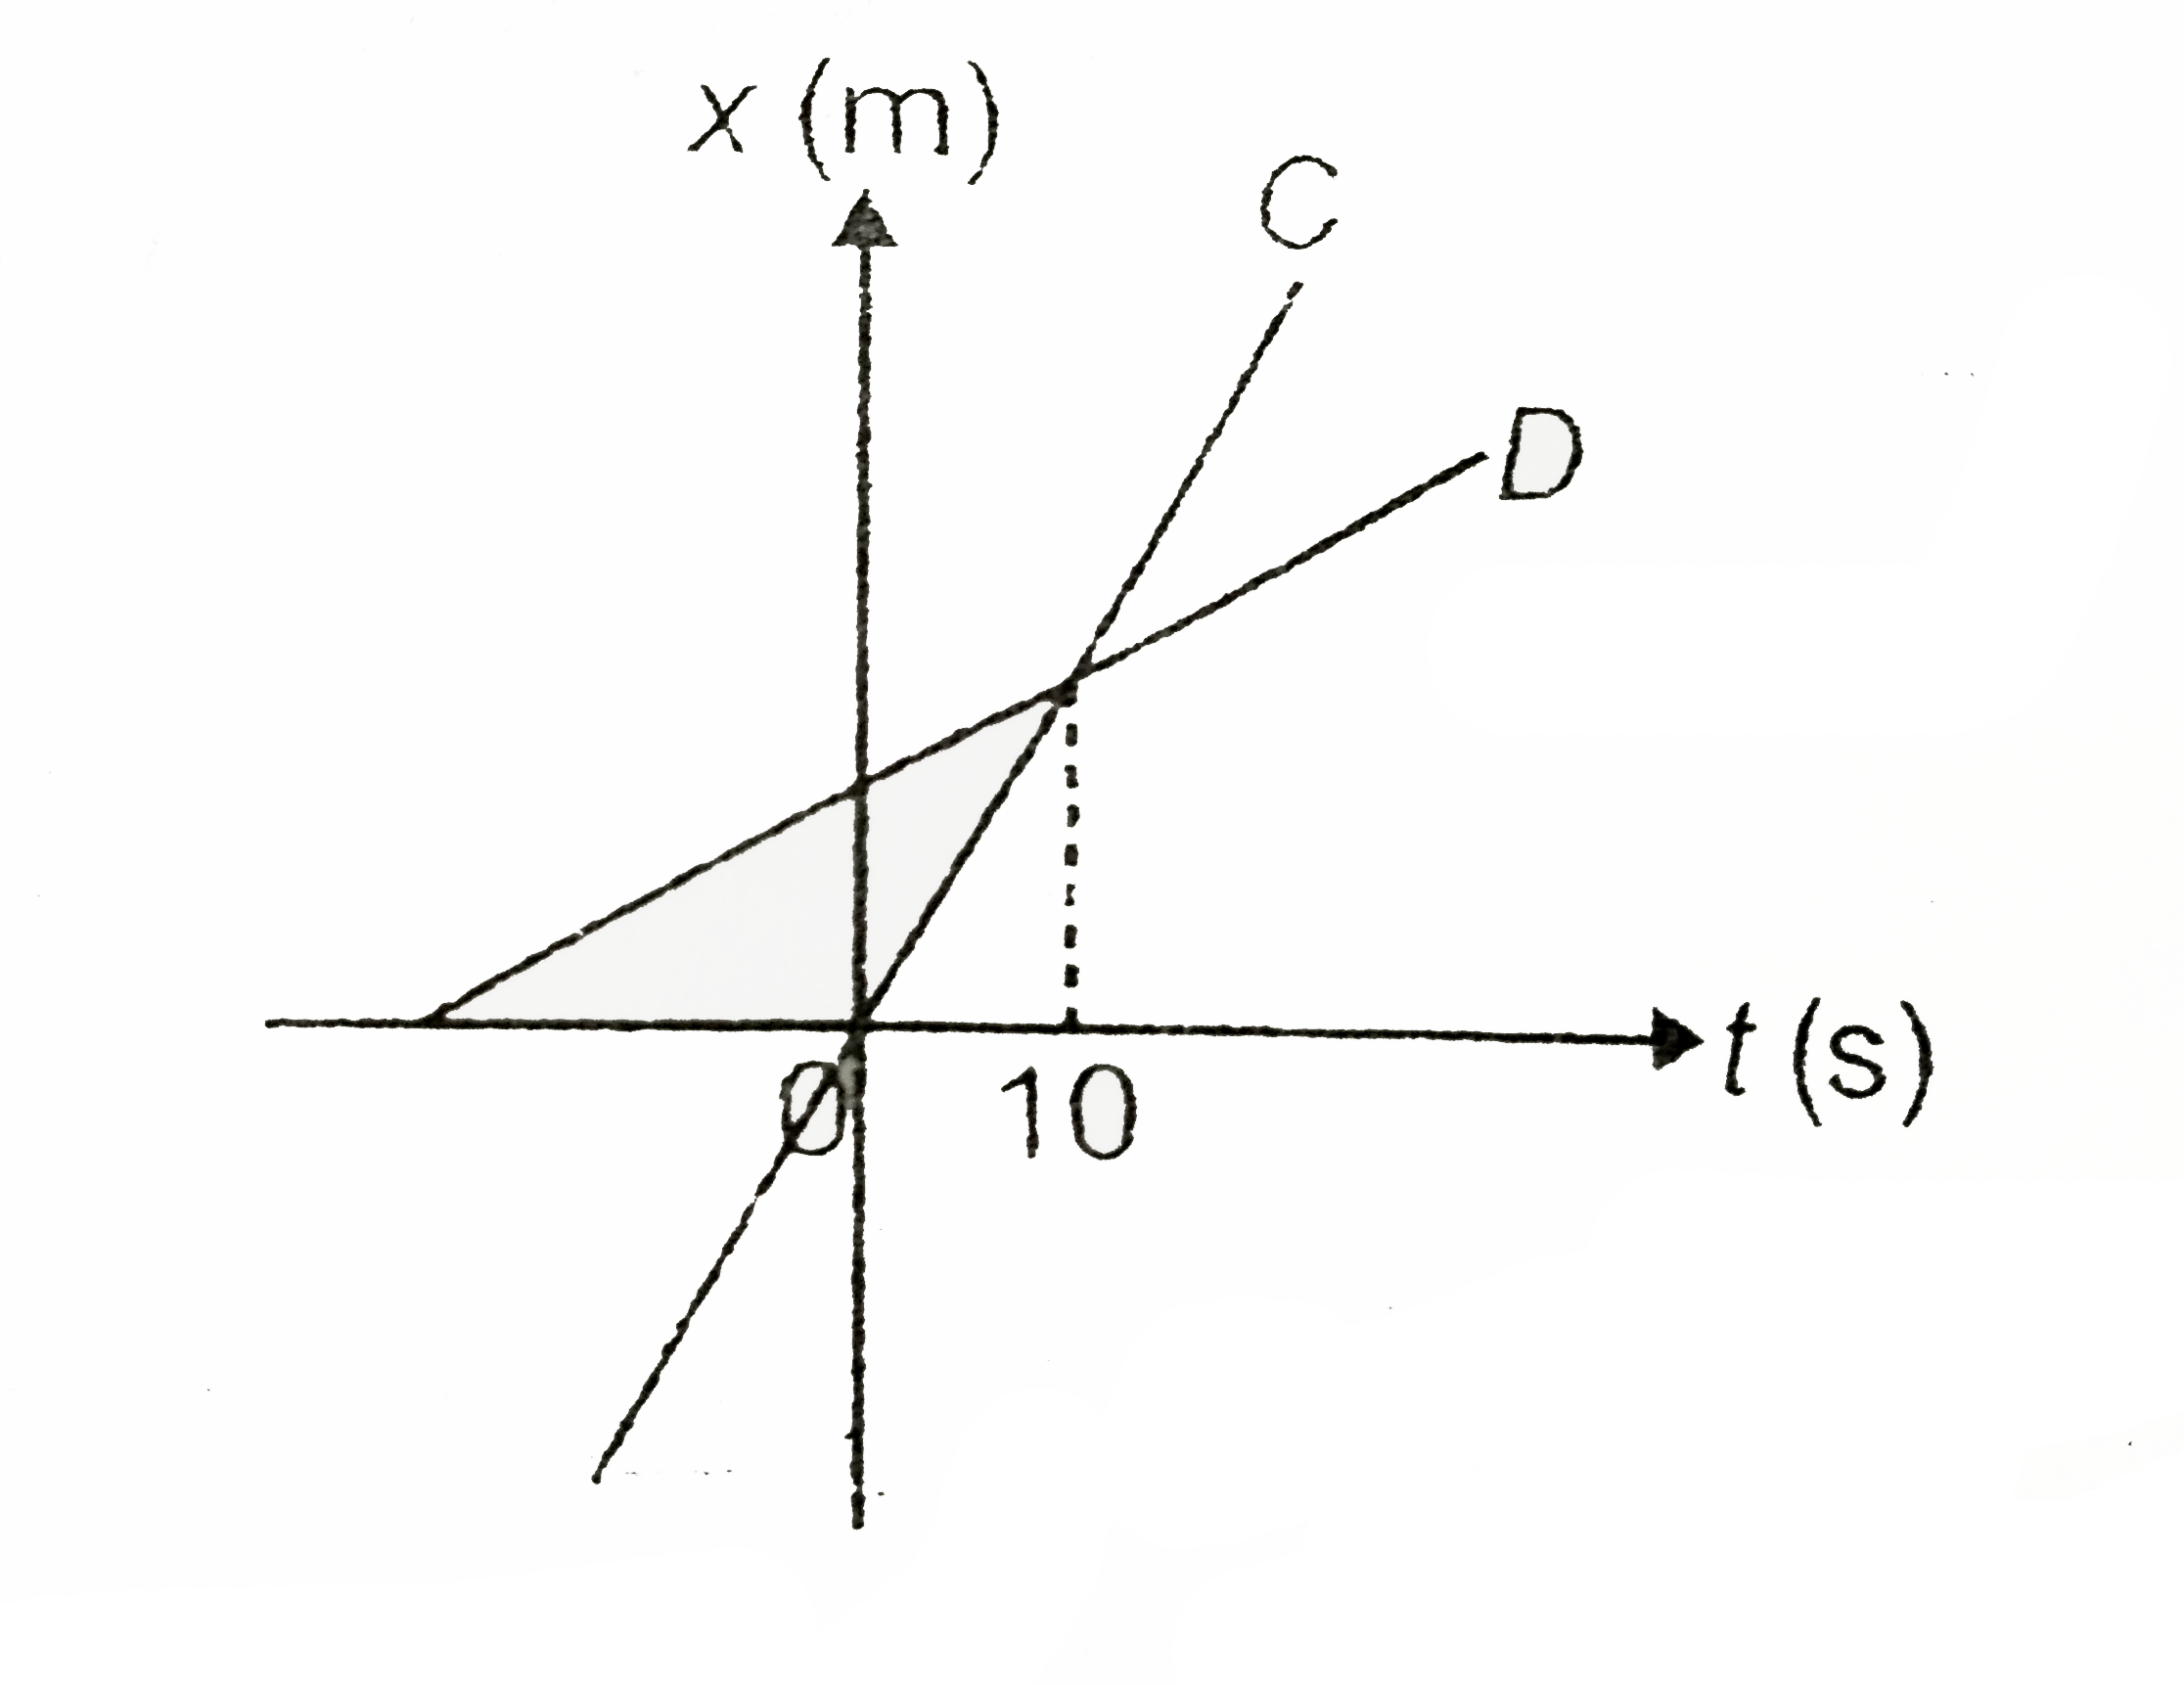
View SolutionThe figure shows position time graph of two riders C and D. Based on the information represented by the graph, answer the following questions.
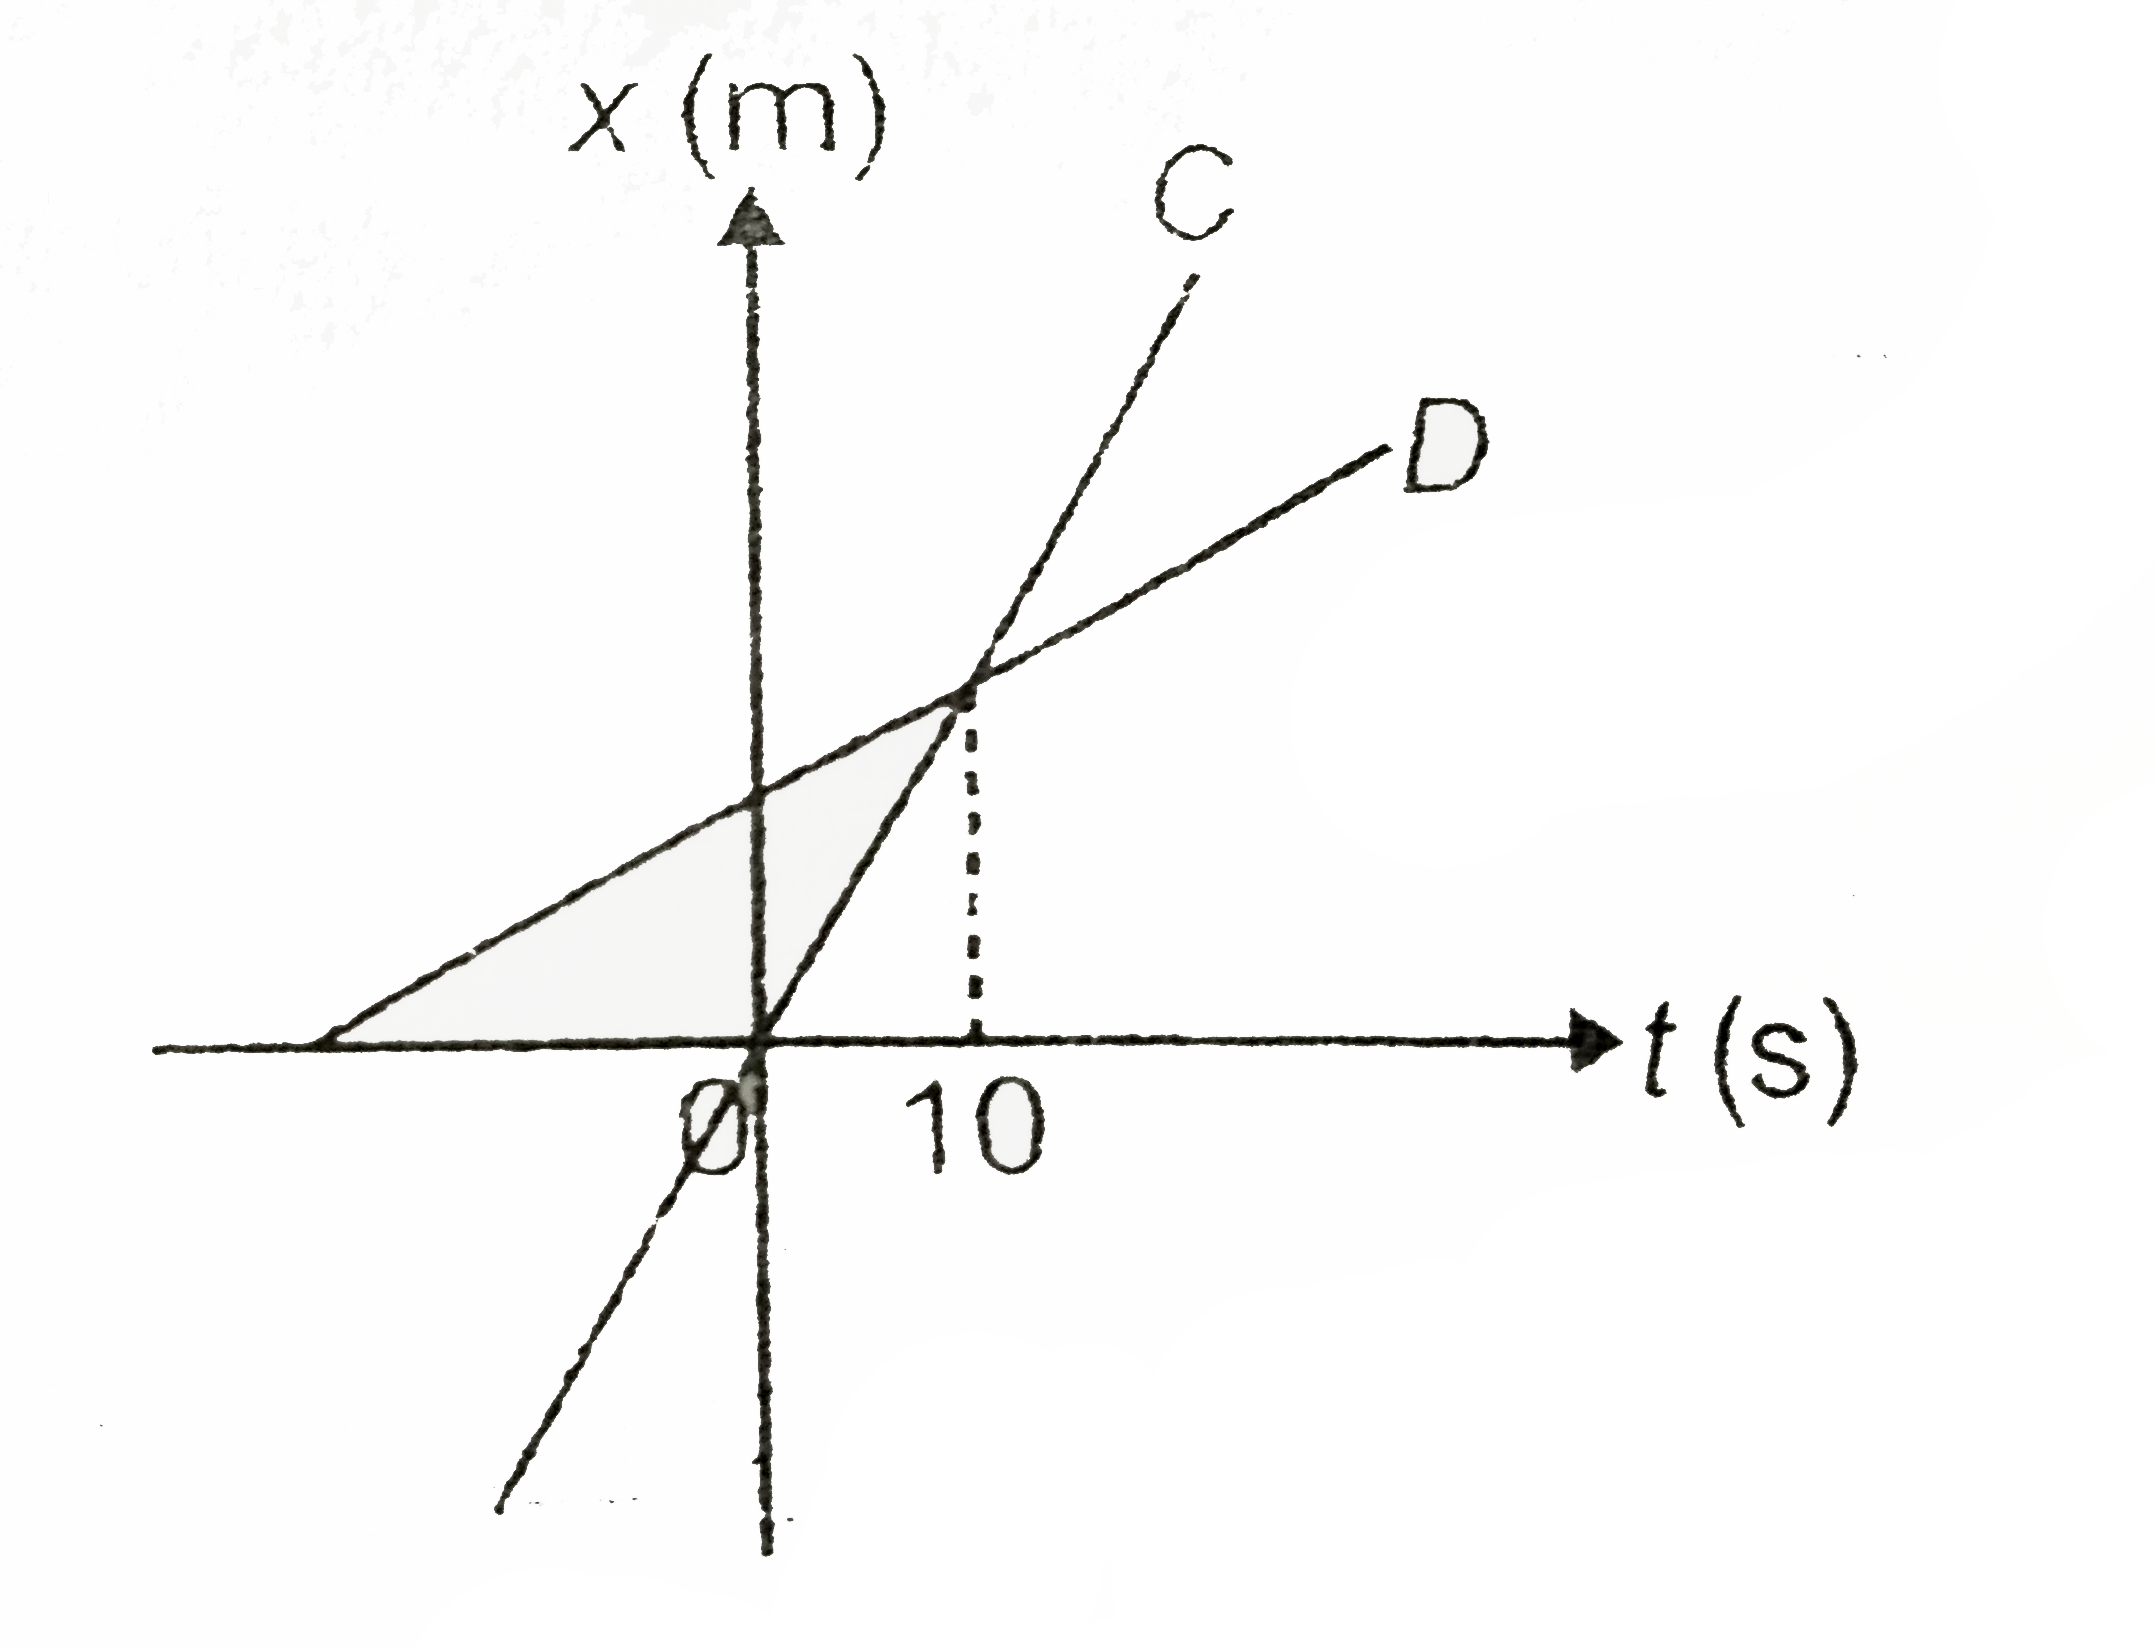
At t = 0 s
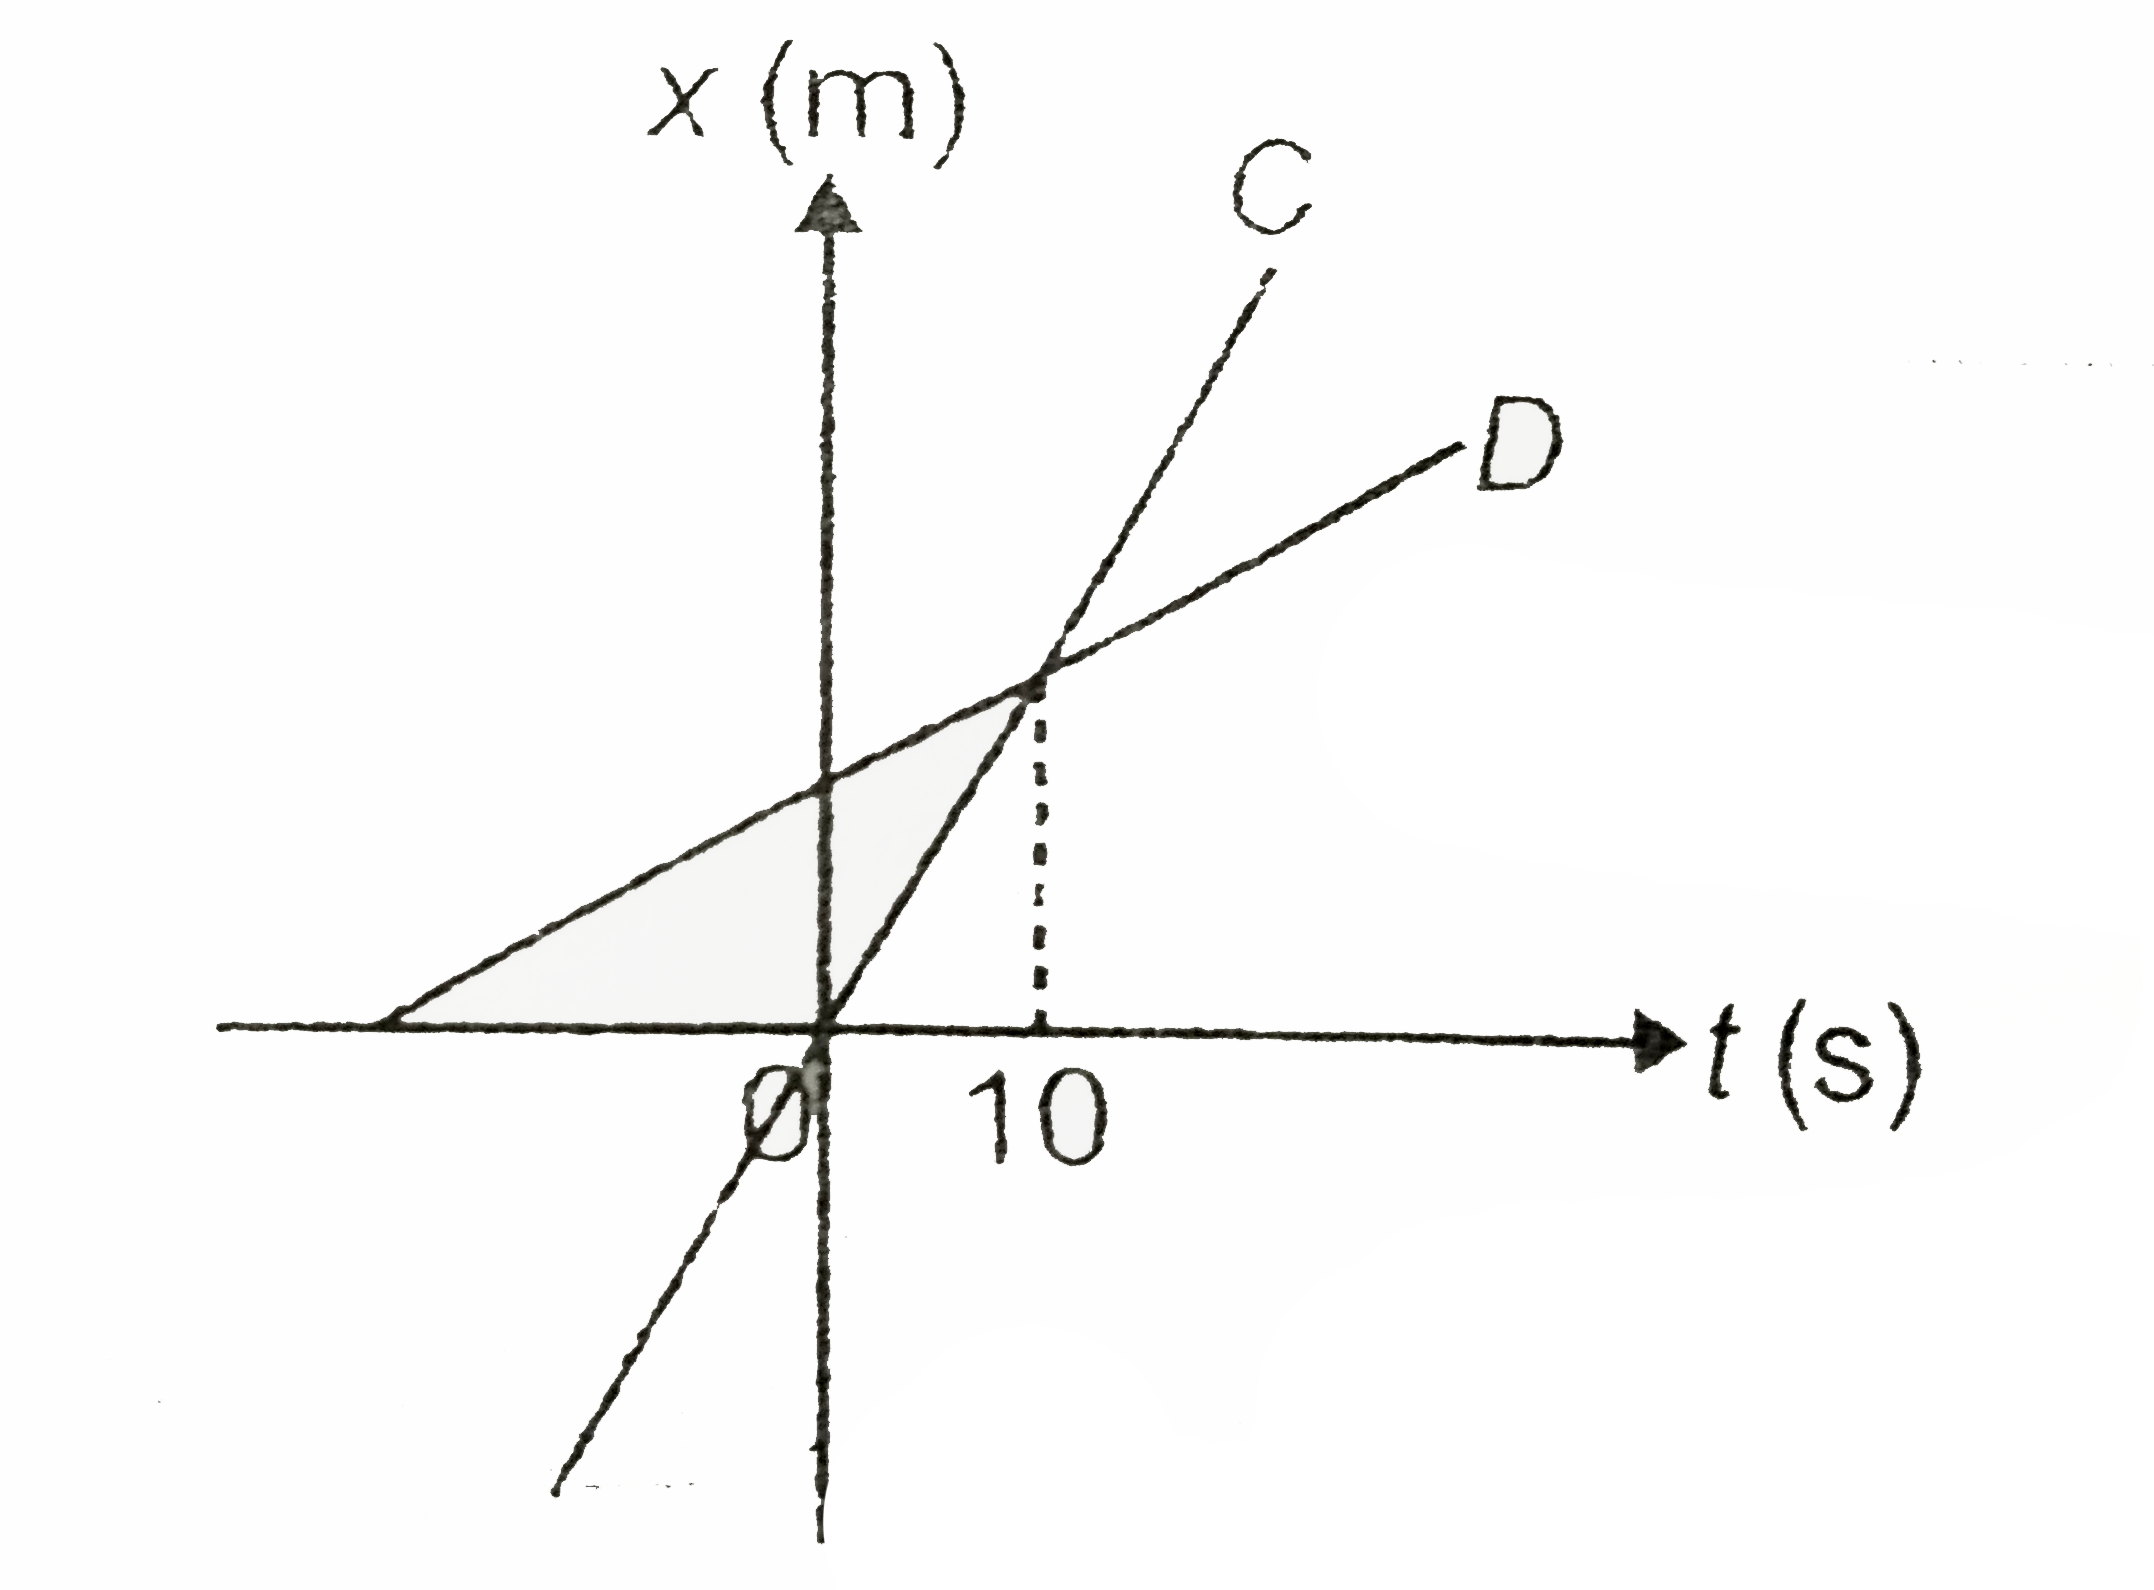
View SolutionThe figure shows position time graph of two riders C and D. Based on the information represented by the graph, answer the following questions.
At t = 10 s
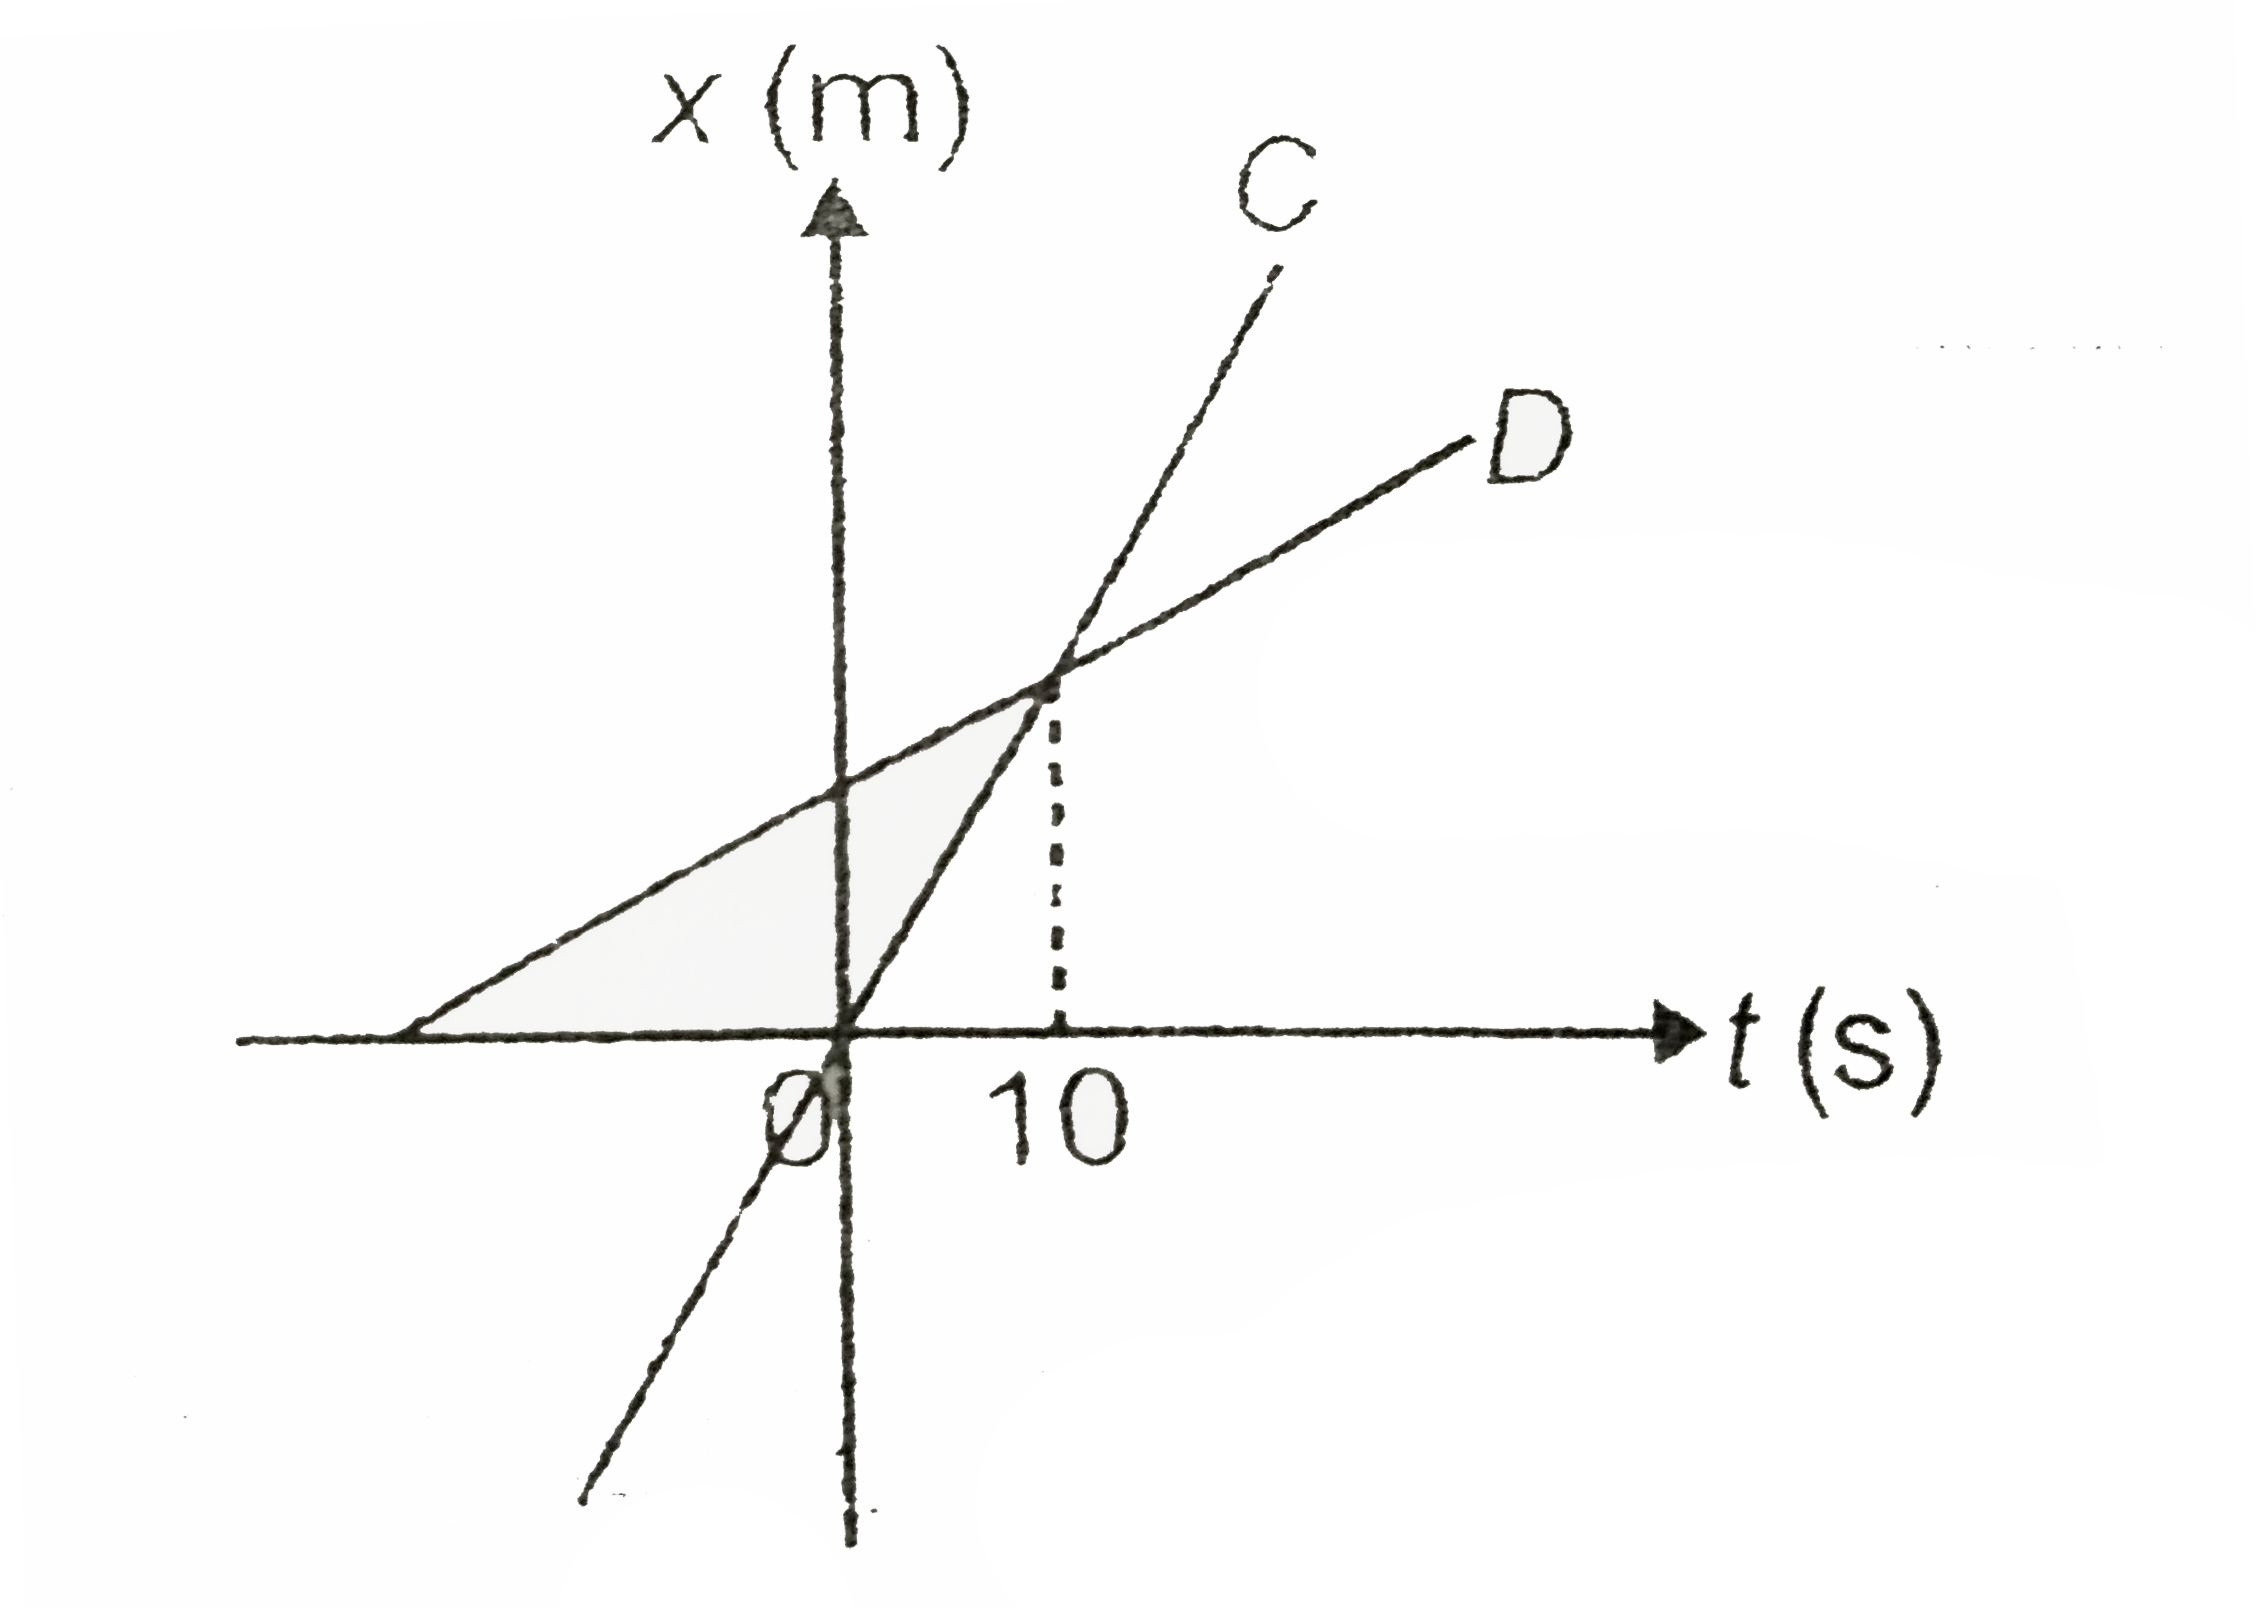
View SolutionThe figure shows position time graph of two riders C and D. Based on the information represented by the graph, answer the following questions.
At t = 0 s
View SolutionThe figure shows position time graph of two riders C and D. Based on the information represented by the graph, answer the following questions.
At t = 0 s
View SolutionWhich one of the given graphs shows the effect of pH on the velocity of a typical enzymatic reaction (V) ?
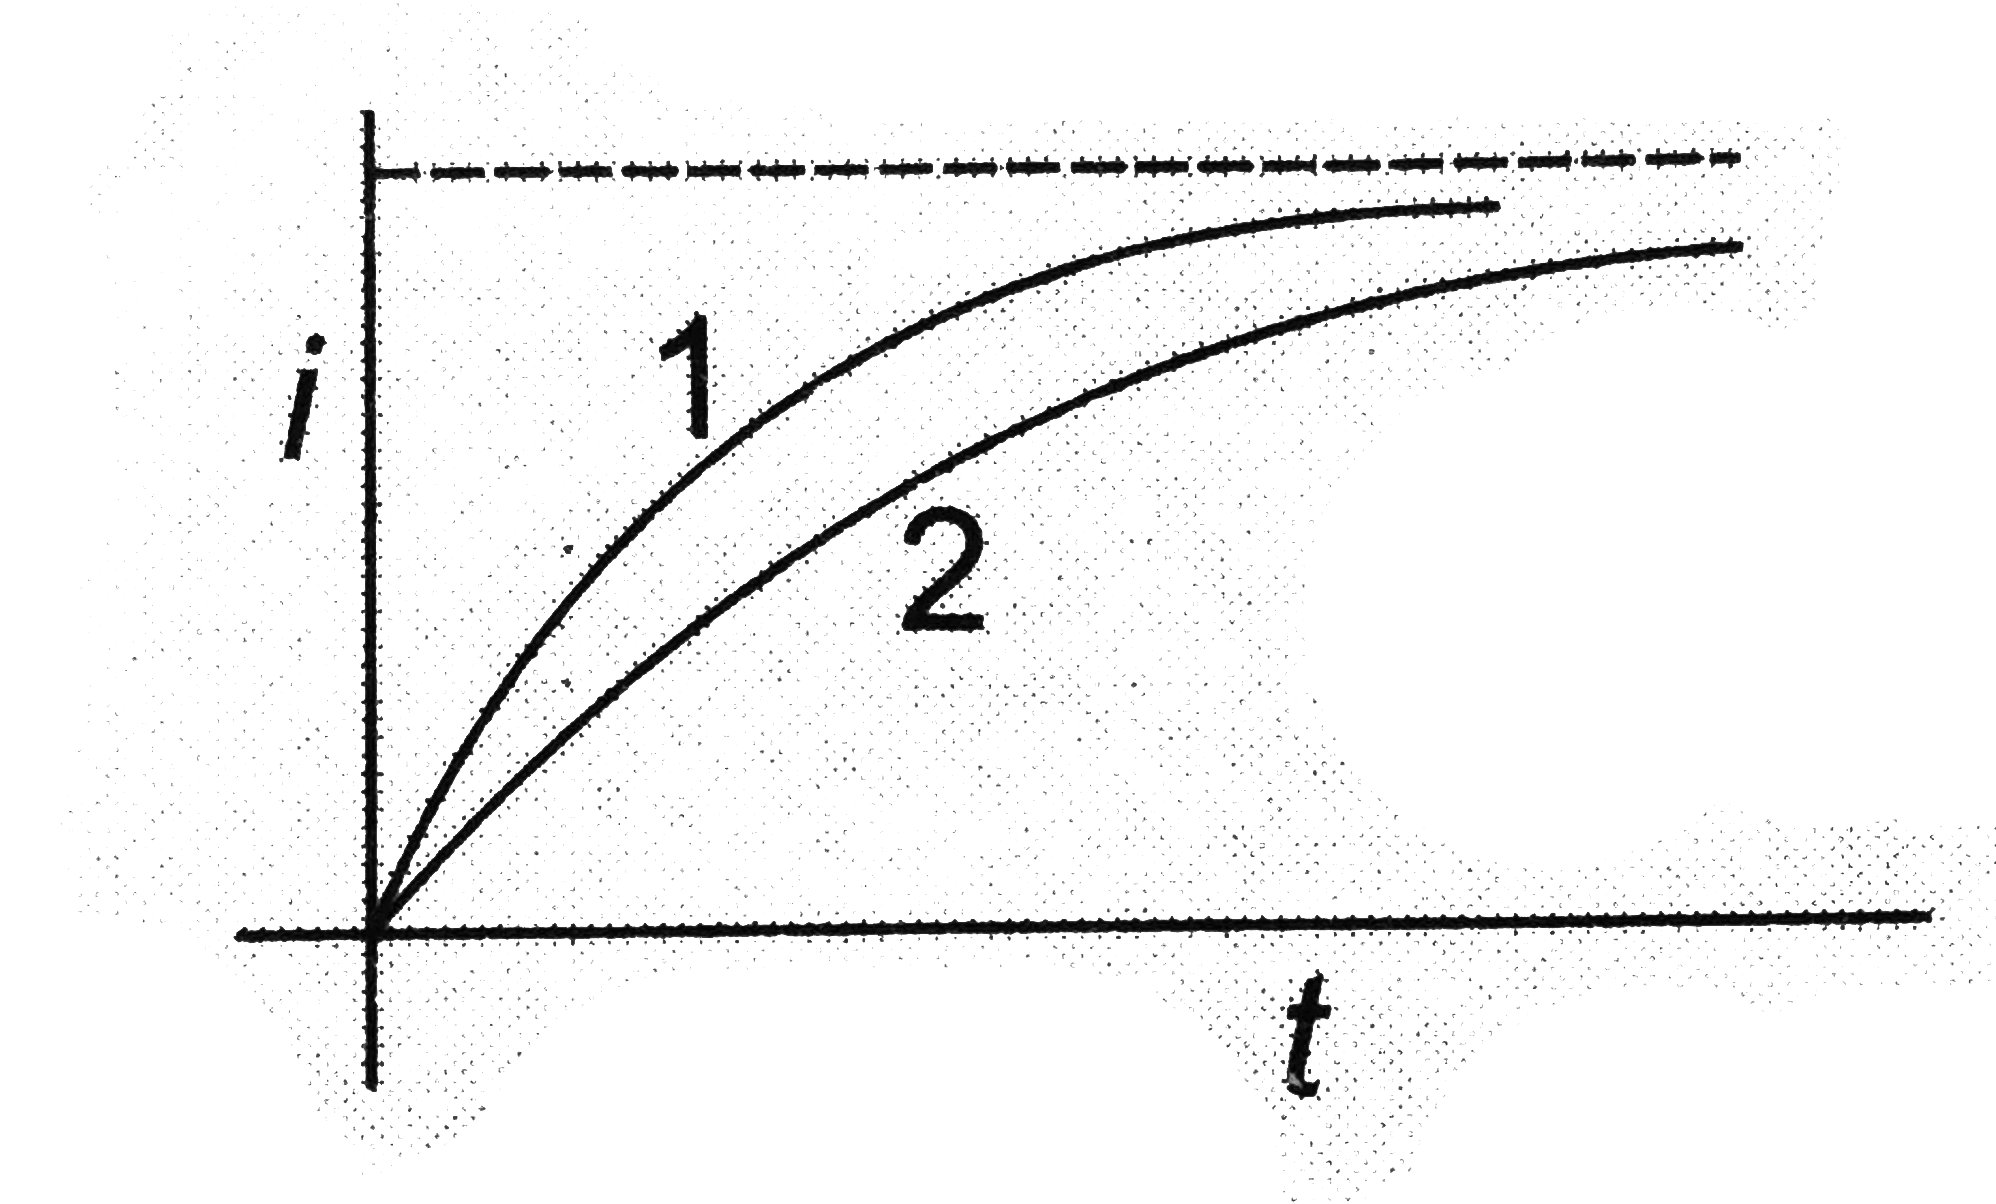
View SolutionWhich of the two curves shows has lesser time constant.
View Solution
