Drawings I and II show two samples of electric field lines
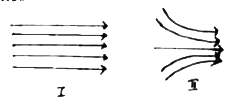
The electric field in both I and II are produced by negative charge located somewhere on the left and positive charges located somewhere on the right
In both I and II the electric field is the same every where
In both cases the field becomes stronger on moving from left to right
The electric field in I is the same everywhere, but in II the electric field becomes stronger on moving from left to right.
The correct Answer is:D
Step by step video & image solution for Drawings I and II show two samples of electric field lines by Physics experts to help you in doubts & scoring excellent marks in Class 12 exams.
Updated on:21/07/2023Topper's Solved these Questions
- ELECTRIC CHARGES AND FIELDSBOOK - AAKASH SERIESCHAPTER - ELECTRIC CHARGES AND FIELDSEXERCISE - Exercise-II
56 Videos
- ELECTRIC CHARGES AND FIELDSBOOK - AAKASH SERIESCHAPTER - ELECTRIC CHARGES AND FIELDSEXERCISE - Practice Exercise
57 Videos
- ELECTRIC CHARGES AND FIELDSBOOK - AAKASH SERIESCHAPTER - ELECTRIC CHARGES AND FIELDSEXERCISE - Assess Your Self
13 Videos
- DUAL NATURE OF RADIATION AND MATTERBOOK - AAKASH SERIESCHAPTER - DUAL NATURE OF RADIATION AND MATTEREXERCISE - PRACTICE EXERCISEX
42 Videos
- ELECTRIC FIELD AND POTENTIALBOOK - AAKASH SERIESCHAPTER - ELECTRIC FIELD AND POTENTIALEXERCISE - PROBLEMS (LEVEL-II)
26 Videos
Similar Questions
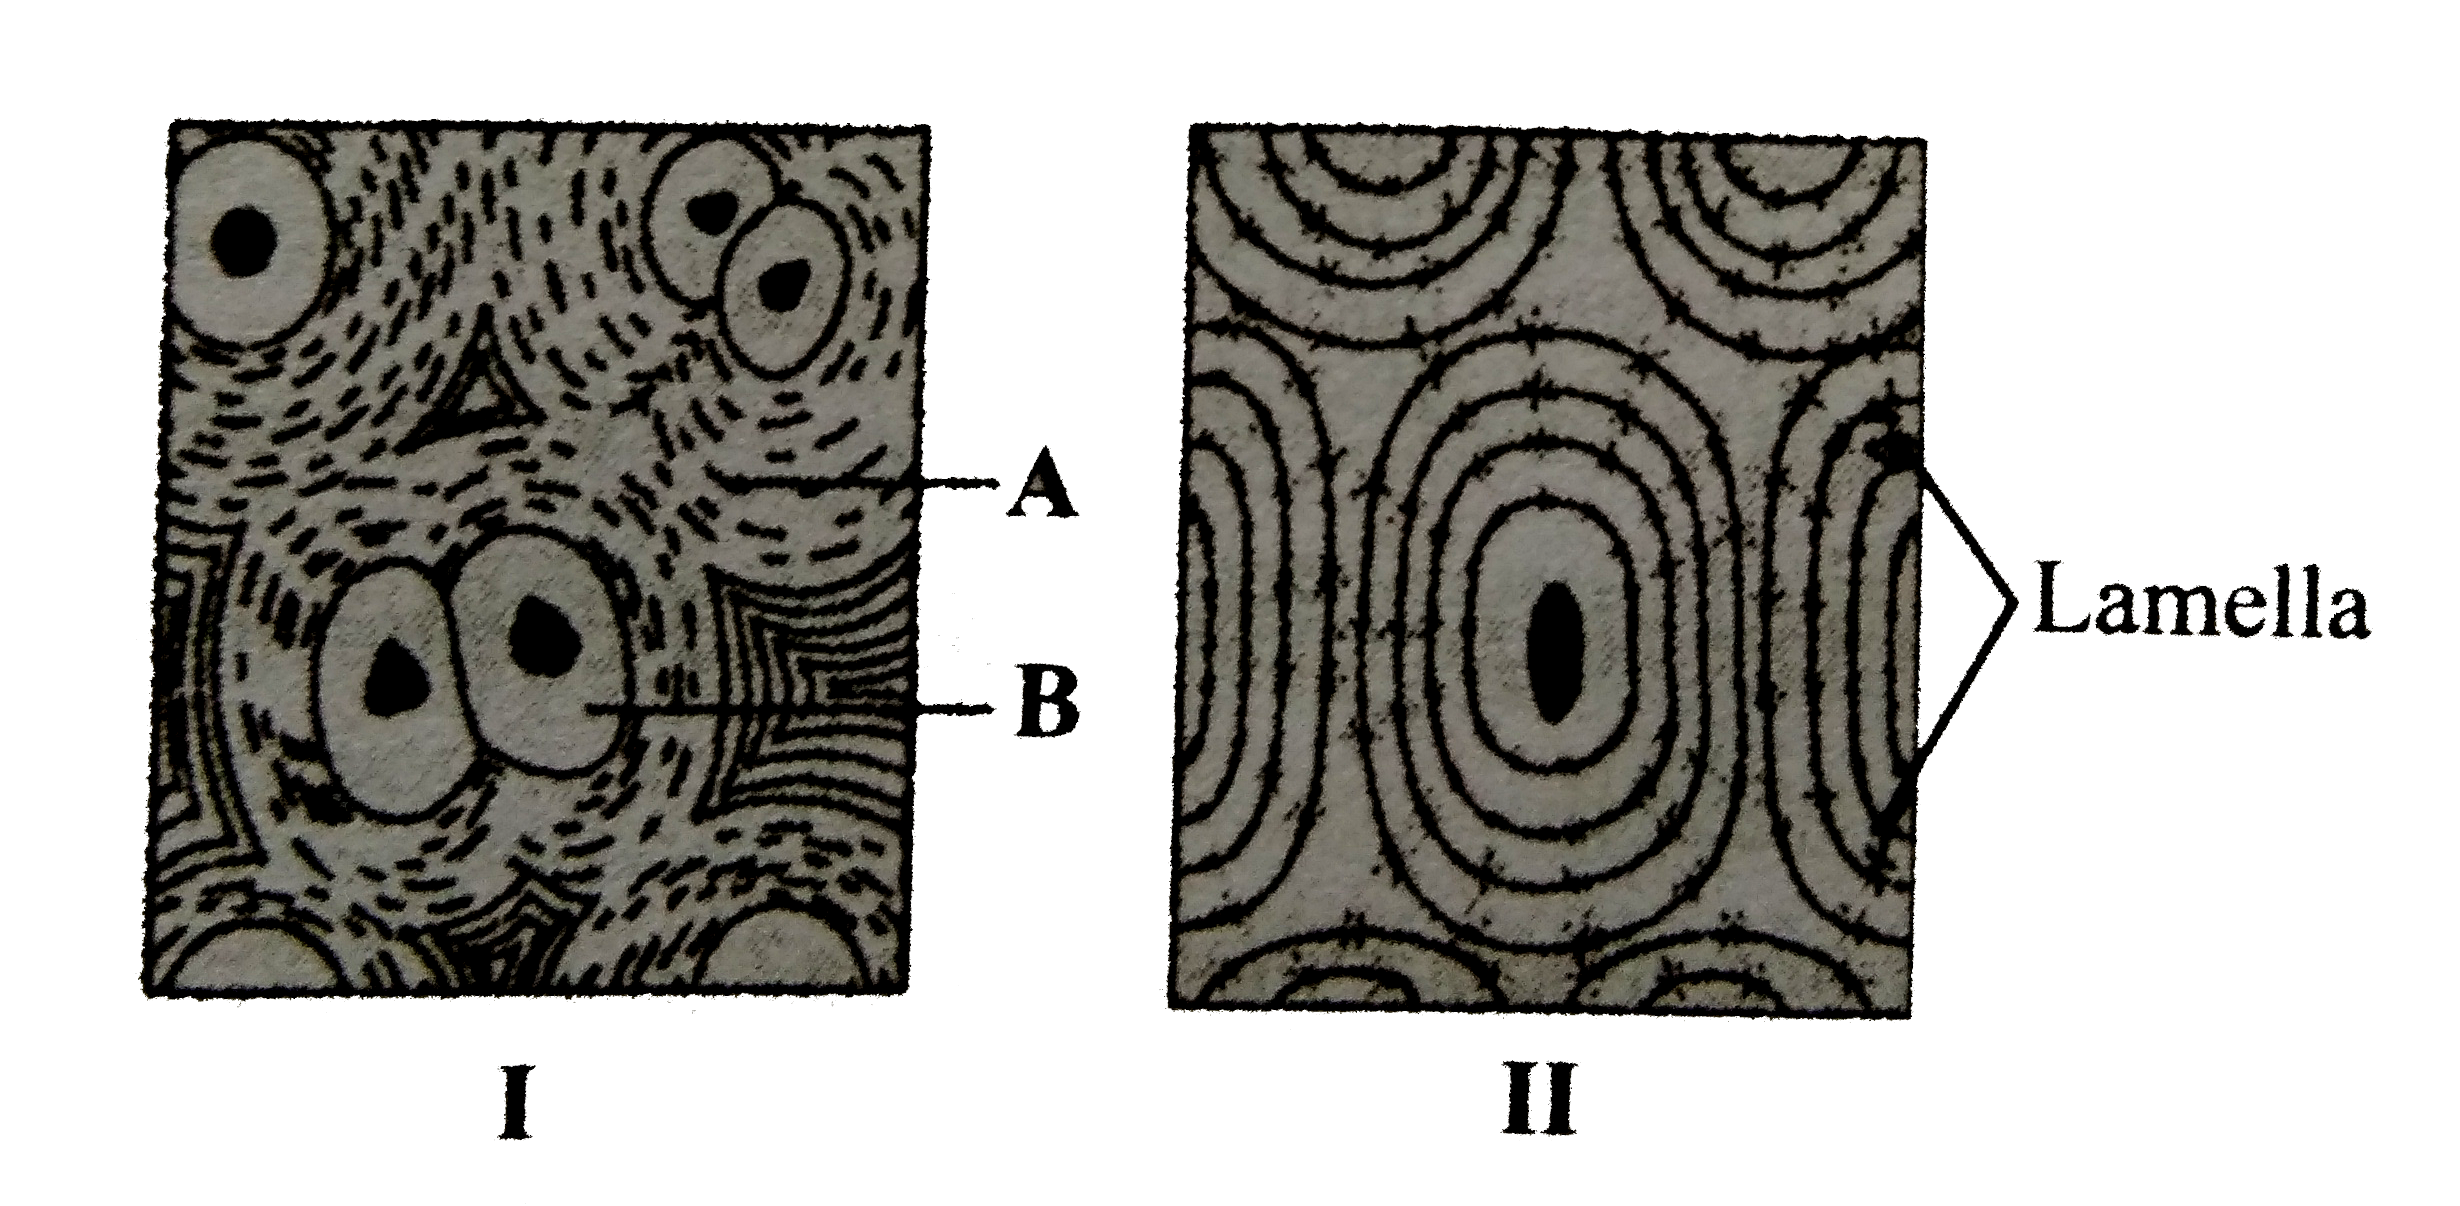
Given figures (IandII) show two specialised connective tissues. Identify the figures I,II and the parts labelled as A and B
View SolutionThe figure shown is a plot of electric field lines due to two charges Q1 and Q2 . The sign of charges is

View SolutionIn figure , there are two patterns of electric field lines absent of dielectric and in presence of dielectric slab. The relative permittivity of the dielectric slab is
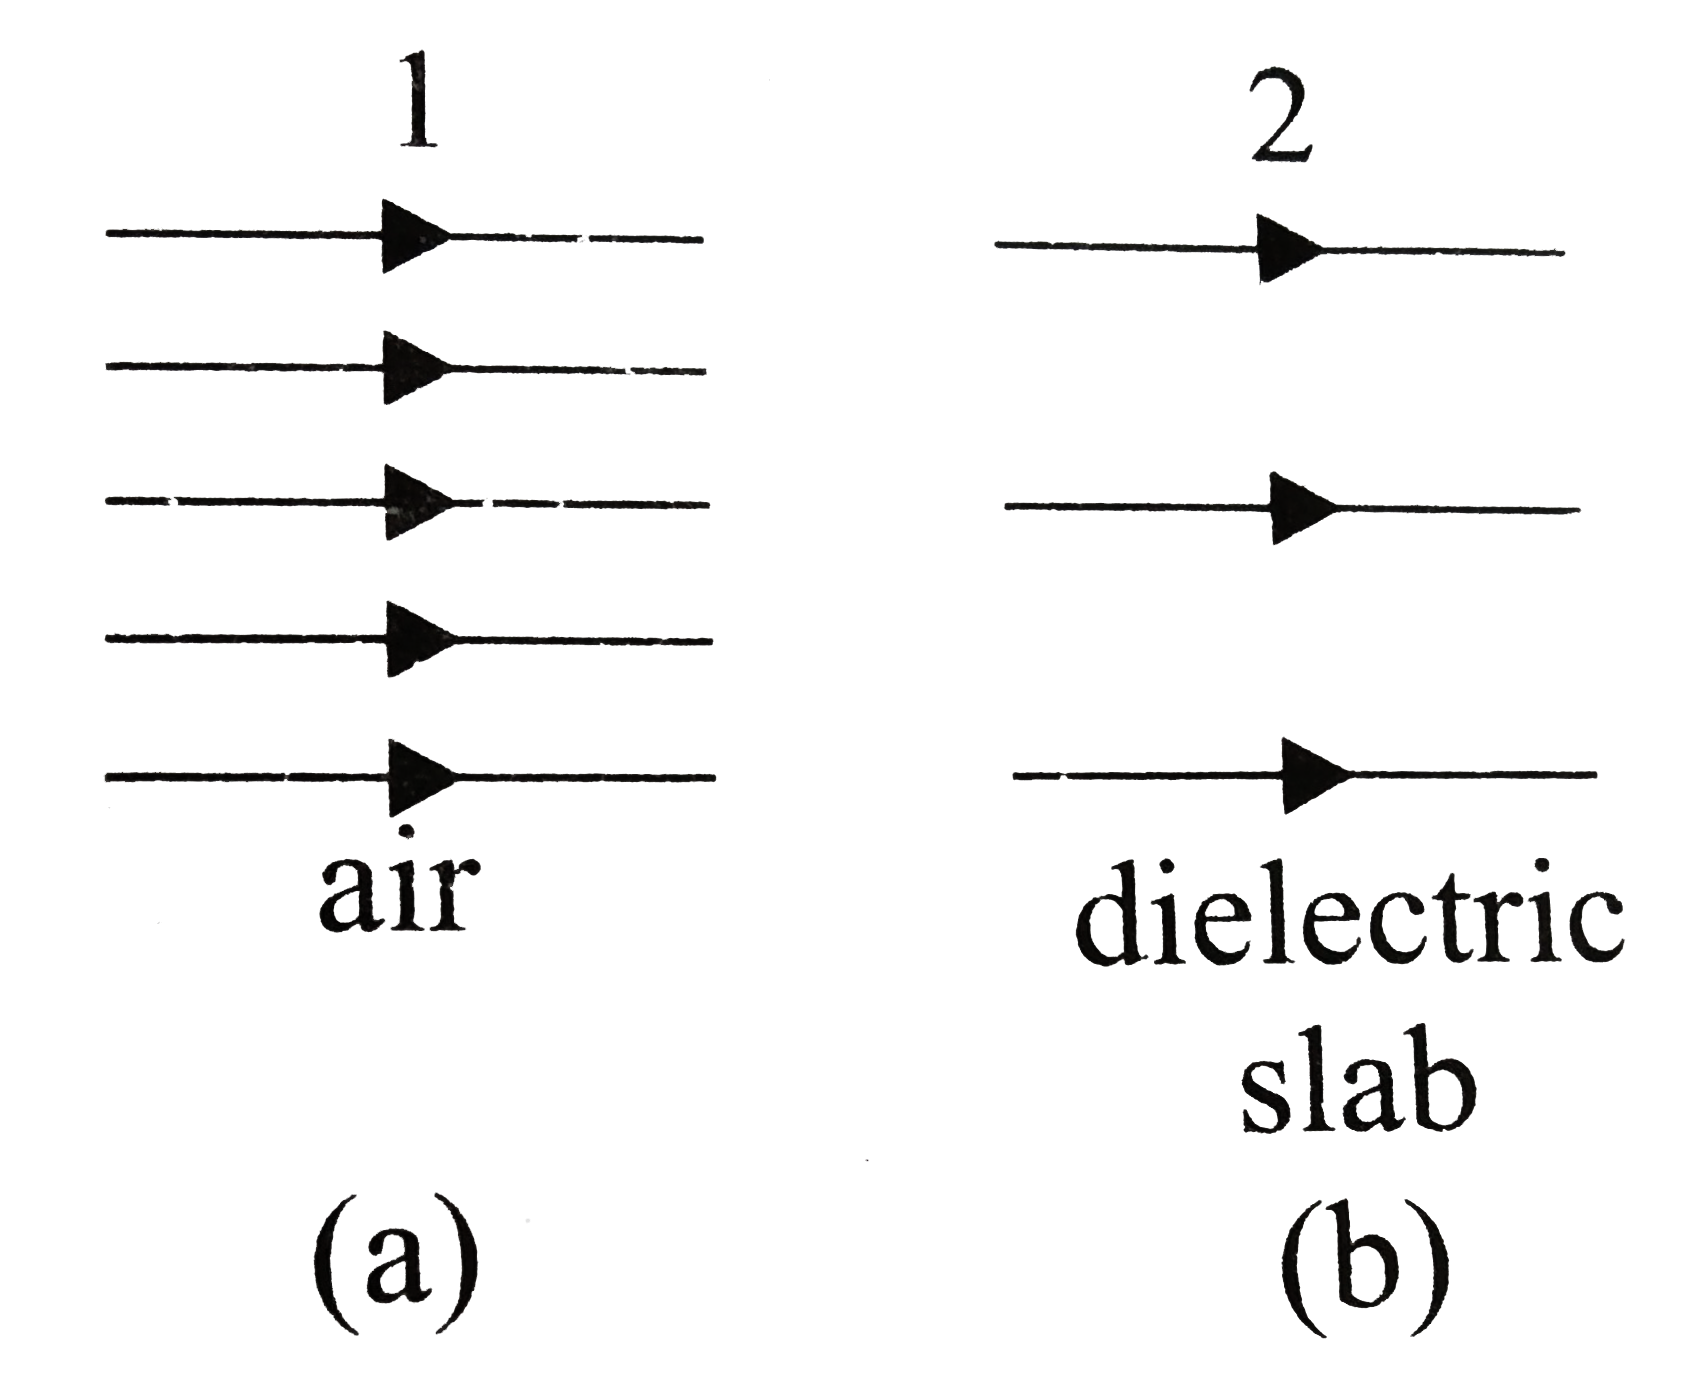 ,
,
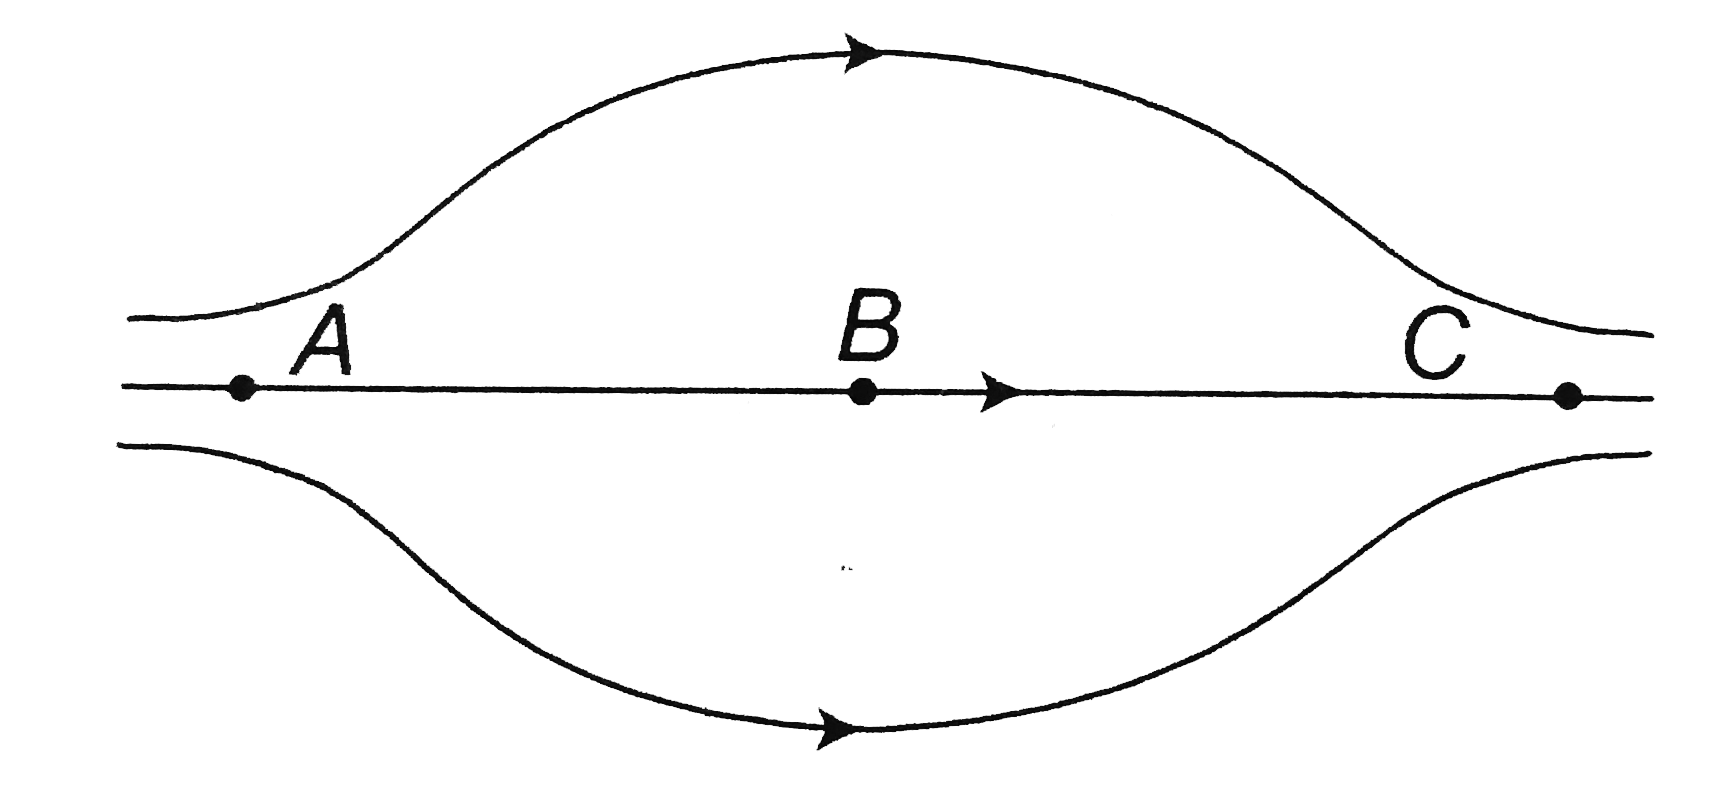
View SolutionThe figure shows some of the electric field lines corresponding to an electric field. The figure suggests
View SolutionDraw a plot showing the variation of (i) electric field (E ) and (ii) electric potential (V) with distance r due to a point charge Q.
View SolutionFigure shows some of the electric field lines correspoinding to an electric field. The figure suggests that
View SolutionDraw a plot showing variation of electric field with distance from the centre of a solid conducting sphere of radius R, having of + Q on its surface.
View SolutionThe adjoining figure shows the lines of constant potential in a region in which an electric field is present. The value of potentials are shown. At which of the points A, B and C is the magnitude of the electric field the greatest?
View SolutionWhat is a solenoid? Draw the pattern of magnetic field lines of (i) a current carrying
solenoid and (ii) a bor magnet. List two distinguishing features between the two fields.
View SolutionFigure shows electric lines of force. If Ex and Ey are the magnitudes of electric field at points x and y respectively, then
View Solution
